Information Technology Reference
In-Depth Information
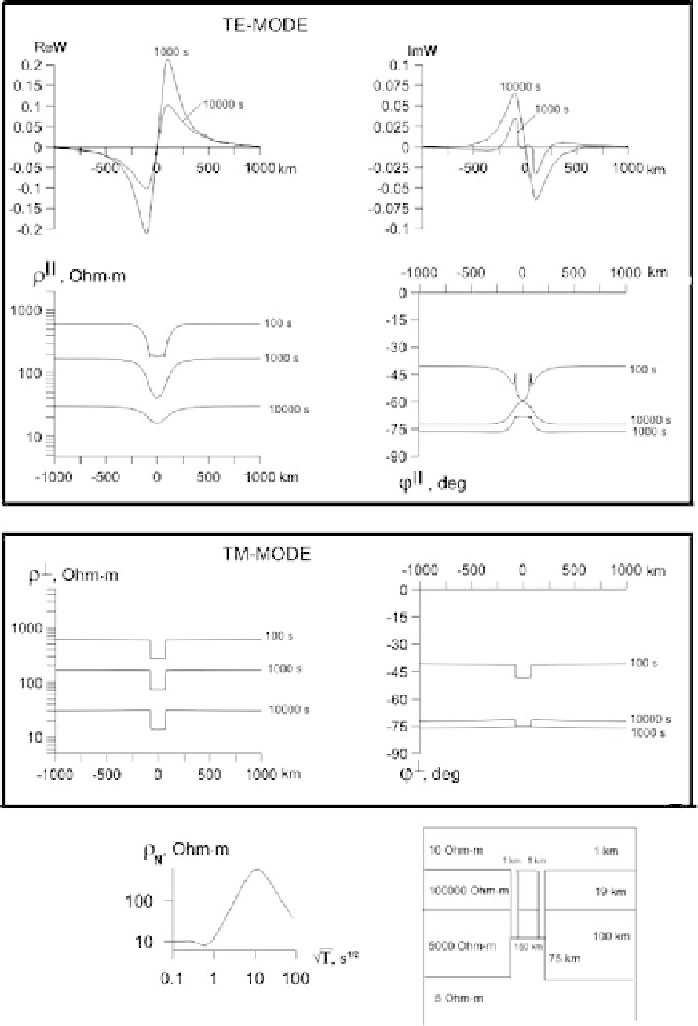
Fig. 12.6
Illustrating the sensitivity of the TM- and TE-modes to deep structures in the presence of
conductive faults. The normal
N
-curve is shown on the lower left. At the top: apparent-resistivity,
impedance-phase and tipper profiles; profile parameter: period T