Information Technology Reference
In-Depth Information
(
T
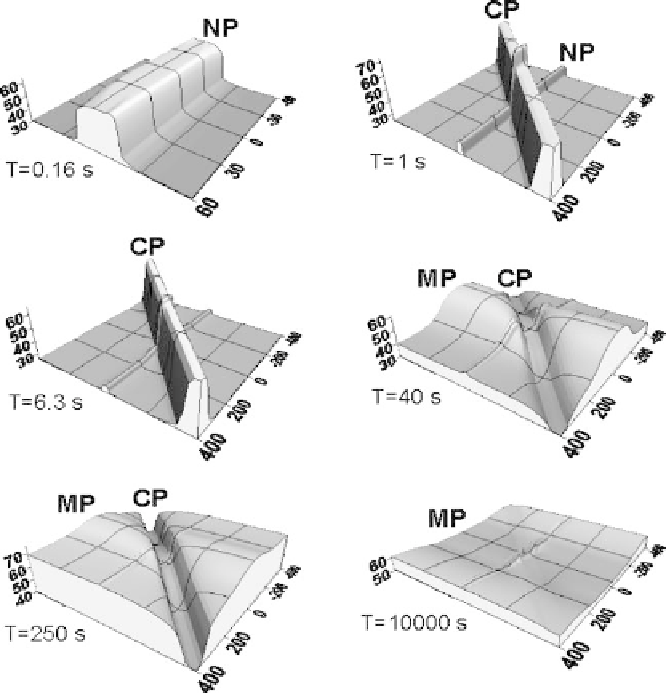
= 250 and 10000 s). Here the mantle-prism image bears evidences of the crustal
prism and even of the near-surfase prism.
The pseudo-topography of the phase
16 s,
the high-resistivity near-surface prism is imaged as a 2D “horst” with an azimuth of
0
◦
. When lowering frequency, this effect attenuates rather rapidly, giving place to
the effect of the conductive crustal prism imaged as a 2D “horst” with an azimuth of
-45
◦
(
T
=1 and 6.3 s). As the frequency is further decreased, the effect of the near-
surface prism virtually vanishes and we can see the superimposition of the crustal
and mantle effects (
T
= 40 and 250 s). Here the conductive mantle prism is imaged as
a gently sloping uplift striking at -90
◦
. Both the effects are weakly expressed at the
period
T
brd
is shown in Fig. 11.53. At
T
=
0
.
10000 s where the impedance phase reflects the homogeneous mantle
underlying the mantle prism (at depths much greater than 100 km). To sum up, we
=
Fig. 11.53
Pseudo-topographies of the impedance phase
brd
: NP, CP, and MP are, respectively, the
near-surface, crustal, and mantle prisms. The horizontal scale of distances is given in kilometers,
and the vertical scale of phases is given in degrees