Information Technology Reference
In-Depth Information
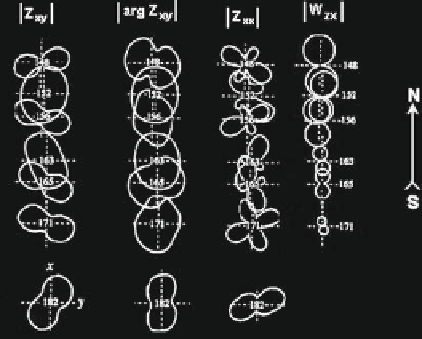
Fig. 11.42
Polar diagrams of
the impedance tensor and
Wiese-Parkinson matrix
along a profile crossing the
Kirghiz Tien Shan
T
=
1600
s
being rather narrow. This confidently indicates the regional two-dimensional back-
ground with the sublatitudinal strike.
11.4.3 Drawing the Profiles, Maps, Pseudo-Sections
and Pseudo-Topographies of MT and MV
Response Functions
More detailed information on the shape and position of geoelectric structures can
be obtained from the profiles, maps, pseudo-sections and pseudo-topographies of
magnetotelluric and magnetovariational response functions. We will consider sev-
eral examples demonstrating the informativeness of these graphical representations.
Figure
11.43 presents the
electric (telluri
c) and magnetic effec
tive intensities,
D
eff
=
|
and
M
eff
=
|
, along a profile
crossing the East Urals and the Tobol'sk tectonic zone. The thickness of the sandy-
argillaceous Cenozoic and Mezozoic strata increases from 600 m near the Urals to
2000 m in the vicinity of Tobol'sk. Some small-scale structures are seen against this
background. Here
D
eff
and
M
eff
are in rather good agreement with each other. They
evidently reflect the regional Mezozoic topography. To downsinking of the bottom
of the Mezozoic sediments there corresponds a decrease in
D
eff
and an increase
in
M
eff
. Such a correlation is typical for regions with quiet tectonics and gentle
geoelectric variations in the absence of high resistive screening layers.
Quite different picture is observed in regions, where the sediments contain high
resistive screening layer. Here the electric intensity
D
eff
reflects the topography of
this layer, while the magnetic intensity
M
eff
can reflect the crystalline basement
topography.
D
xx
D
yy
−
D
xy
D
yx
|
M
xx
M
yy
−
M
xy
M
yx
|