Information Technology Reference
In-Depth Information
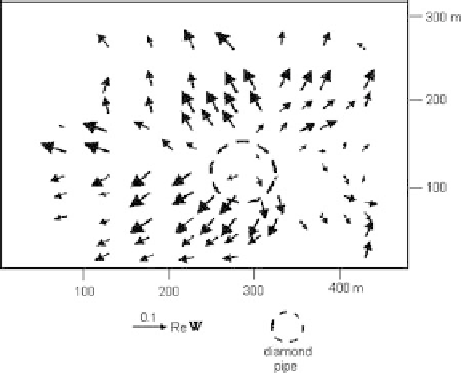
Fig. 11.40
Real
Wiese-Parkinson tippers
Re
W
over the diamond pipe
(Jakutia),
T
=0.001 s
Figures 11.41d,e present the polar diagrams of the
E
- and
H
-polarized
impedances. They show dramatic influence of the near-surface resistive inclusion.
The
Z
E
- diagrams are the most intriguing. Their orientation changes rather sharply
following the direction of the current flowing around the resistive inclusion. Here
the flow-around effect is more pronounced than in the
-diagrams.
Polar diagrams of the phase tensor are shown in Fig. 11.41f,g. The great majority
of the
|
Z
xy
|
xx
-diagrams have the shape of regular ovals elongated along the strike of the
deep regional prism. Being analogues of the
-diagrams, they are similar in
shape but are oriented at a right angle. The directions of the maximum diameter of
the
|
arg
Z
xy
|
xx
- diagrams determine the strike of the prism, and the minimum and max-
imum half-diameters yield the phases of the transverse and longitudinal regional
impedances
arg
Z
⊥
|
arg
Z
|
|
and
|
. Uncertainties of these determinations may reach
10-12
◦
. Almost all the
xy
- diagrams appear as four-petal flowers, and the bisectors
between the petals are directed along and across the strike of the regional prism.
However at two sites we observe rather large deviation from this pattern specific to
the 2D-model. Comparing between (Fig. 11.41f,g) and (Fig. 11.41c), we can see that
the phase diagrams of the impedance tensor are less distorted by the near-surface
inclusion and better approximate the deep two-dimensional prism than the diagrams
of the phase tensor. This can be explained by the fact that the phase tensor is defined
without taking into account the near-surface magnetic anomalies.
It seems that the combined analysis of impedance polar diagrams can be usefull
in separating the local and regional effects. The analysis is most effective with the
E
- polarized impedance diagrams, characterizing the near-surface structure, and the
phase diagrams of the impedance tensor, throwing light on the deep structure.
This analysis can be supplemented by the analysis the tipper diagrams, which
expose the near-surface structure on high frequencies and the deep structure on
the low frequencies. The tipper diagrams have the form of figure-eight, their waist
defines the departure from the two-dimensionality and they can bring an arrow,
which points away from the conductive zone.