Information Technology Reference
In-Depth Information
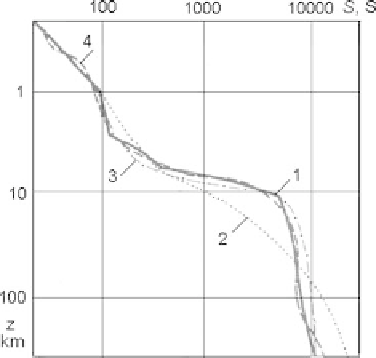
Fig. 11.31
S-
distribution
obtained by Zohdy
transformation shown in
Fig. 11.30; 1 - original data,
2 - result of the differential
Molochnov-Viet
transformation, misfit in
apparent resistivity 96%,
3 - result of Zohdy's
transformation, 12 iterations,
misfit in apparent resistivity
16%, 4 - result of Zohdy's
transformation, 39 iterations,
misfit in apparent
resistivity 1%
layers. The boundaries between conductive and resistive layers are reflected in the
maxima of curvature of
S
(
z
). Let us correlate the
S
-distributions at sites 1-11.
In most cases they present a five-layer strata. Connecting the curvature maxima,
we outline the conductive layer in the lower crust (25-50 km) underlaid with the
resistive mantle (50-100 km) and the mantle conductor (
>
100 km). Note that in
some places the smoothness of boundaries is violated (may be, because of three-
dimensional distortions). Of course, the accuracy of these results leaves much to
be desired and they need further consideration. But “exploration problems some-
times require a simple 'yes' or 'no' answer to the question such as 'Does a buried
conductor exist here?'” (Vozoff, 1991).
Fig. 11.32
Correlating the
vertical
S-
distributions along
the river Podkamennaya
Tunguska