Information Technology Reference
In-Depth Information
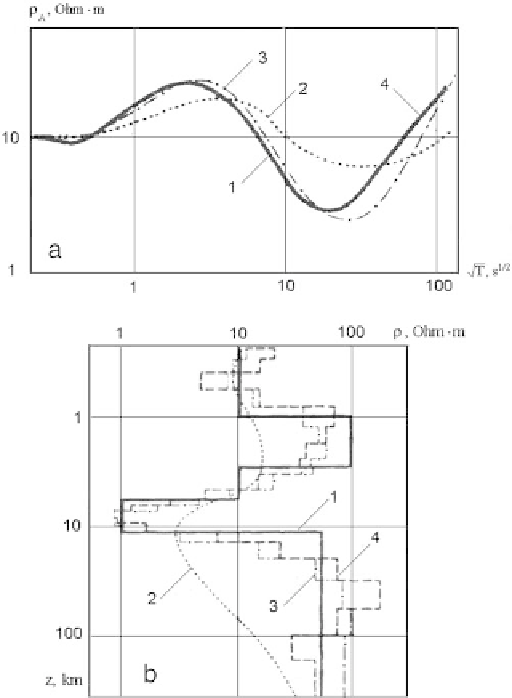
Fig. 11.30
Zohdy transformation of an apparent resistivity curve; a - apparent resistivity curves:
1 - original data, 2 - result of the differential Molochnov-Viet transformation, misfit in apparent
resistivity 96%, 3 - result of Zohdy transformation, 12 iterations, misfit in apparent resistivity 16%,
4 - result of Zohdy transformation, 39 iterations, misfit in apparent resistivity 1% b - resistivity
profiles: 1,2,3,4 are the same as above
iterative corrections reduce the
A
-response misfit to 16 % (12 iterations) and 1 %
(39 iterations). Now the resistivity distributions
(
z
)come near to the original one,
though conspicuously differ in details. But note that the conductance distribution
S
(
z
) obtained by 39 iterations virtually merges with original one (Fig. 11.31). It is
determined stably and characterizes the whole variety of equivalent solutions of the
one-dimensional inverse problem (Berdichevsky and Dmitriev, 2002).
Let us gain the benefit from
S
(
z
) and stratify (at least roughly) the lithosphere in
the Tungus syneclise. Figure 11.32 shows a set of the
S-
distributions obtained along
the river Podkamennaya Tunguska. Here the main indicator of the geoelectric strat-
ification is the rate of vertical changes of the conductance
S
(
z
). Fast and moderate
changes correspond to conductive layers, while slow changes relate to resistive