Information Technology Reference
In-Depth Information
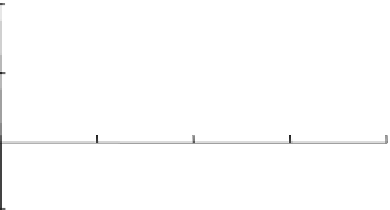
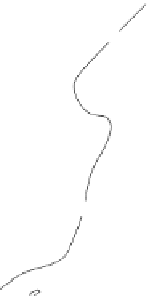
Fig. 11.21
Autocorrelation
function of
xy
values along
the profile AB
R
1.0
0.5
B
A
50
100
150
0
t,
km
-0.5
One can see that low-frequency branches of the filtered curves come closer together
reflecting regular, large-scale variations in apparent resistivities.
Let us consider an example of another filtering technique employed by company
North-West Ltd (Russia) for suppressing geoelectric noise along single profiles.
Figure 11.24 presents a set of graphs showing spatial variations of
Z
xy
at different
periods
T
. The strong
-effect with sharp outliers replicated at all
T
from 14 to
1000 s is in evidence here. These static distortions are suppressed by smoothing a
graph obtained for
T
= 14 s. To this end we remove the most dramatic outliers and
use an exponential low-frequency filter
a
b
Jg
Jg
Bt
Bt
A
400
020406080km
B
1
A
B
2
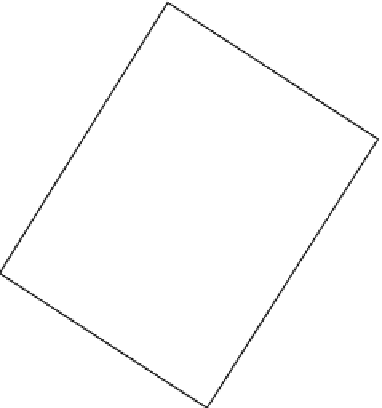
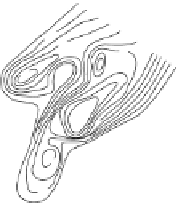
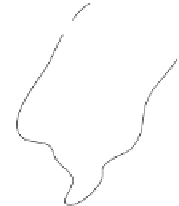
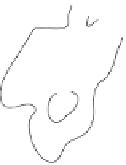
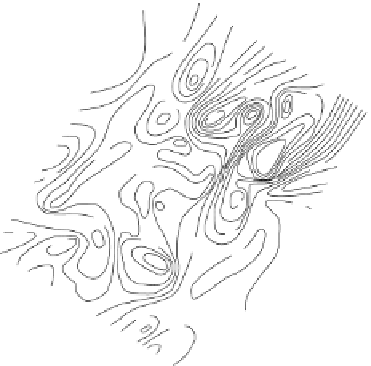
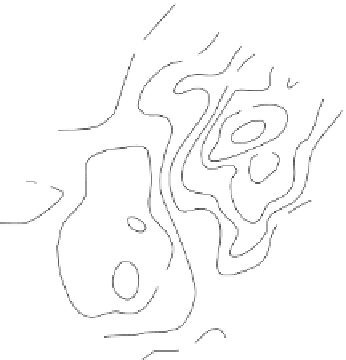
Fig. 11.22
Filtering the apparent-resistivity map: 1 - contour of
xy
values in Ohm
·
m, 2 - correla-
tion profile