Information Technology Reference
In-Depth Information
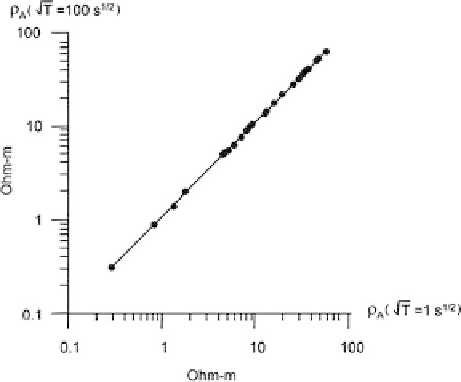
Fig. 11.13
Correlation
between the apparent
resist
iv
ites
A
(
√
T
=
100 s
1
/
2
)and
A
(
√
T
1s
1
/
2
) related to
descending and ascending
branches of the
=
A
-curves
obtained in the model of the
-effect shown in Fig. 11.1
inhomogeneities and low frequencies corresponding to the large-scale buried
structures of different orders that are the target of MT-survey. In this context, the
suppression of the noise reduces to the low-frequency filtration.
A simplest low-frequency filter can be constructed using a low-order polynomials
(Kaufman, 1988). As an example, take a filter that smoothes the spatial variations
of the effective apparent resistivities:
a
2
x
2
eff
(
x
)
=
a
0
+
a
1
x
+
(11
.
8)
or
a
3
x
2
a
5
y
2
eff
(
x
,
y
)
=
a
0
+
a
1
x
+
a
2
y
+
+
a
4
xy
+
,
(11
.
9)
Fig. 11.14
Averaging the
A
-curves obtained in the
model of the
-effect shown
in Fig. 11.11