Information Technology Reference
In-Depth Information
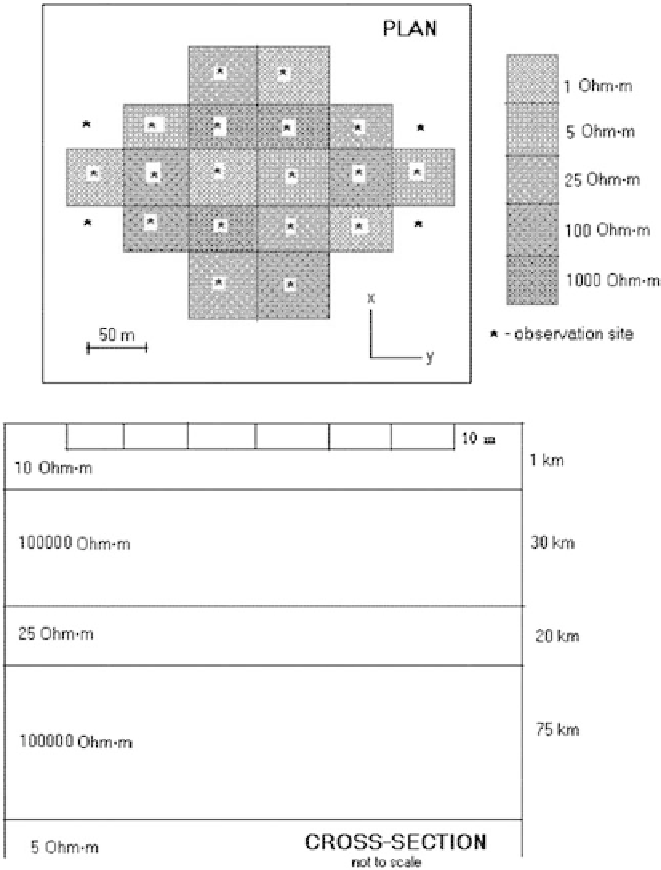
Fig. 11.11
Three-dimensional model of the
-effect
scattered MT data is senseless. But in each zone we can average conformal apparent-
resistivity curves and get
ant
log
1
eff
N
log
eff
=
ˆ
.
(11
.
7)
eff
obtained in zones I and III are shown in
Fig. 11.16. It is indicative that statistical distributions of log
eff
/
Typical histograms of log
ˆ
eff
are fairly well