Information Technology Reference
In-Depth Information
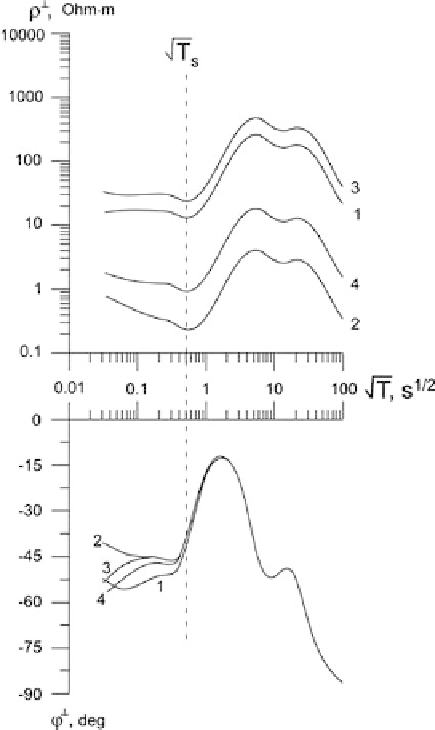
Fig. 11.9
Combined graph of
the transverse
apparent-resistivity and
impedance-phase curves
obtained in the model of the
-effect shown in Fig. 11.6
Fig. 11.10
Correlation
between the apparent
resisti
v
ites
⊥
(
√
T
100 s
1
/
2
)and
=
⊥
(
√
T
1s
1
/
2
) related to
descending and ascending
branches of the
⊥
-curves
obtained in the model of the
-effect shown in Fig. 11.6;
1, 2, 3, 4 - observation sites
=