Information Technology Reference
In-Depth Information
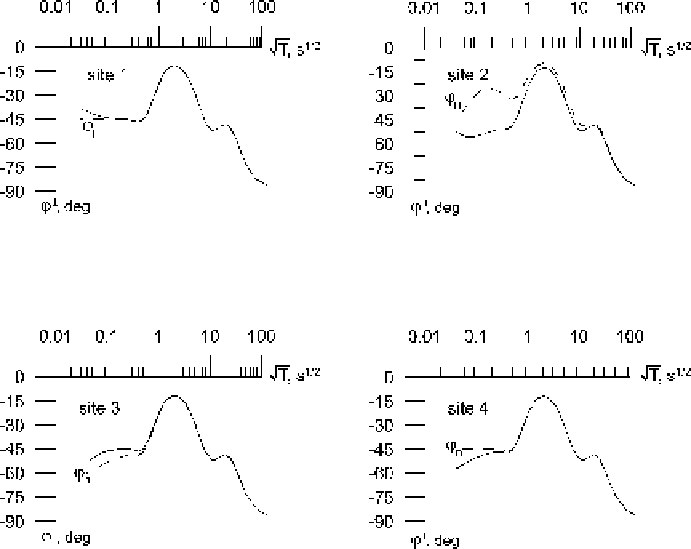
Fig. 11.8
Transverse impedance-phase curves in the model of the
-
effect shown in Fig. 11.6
where
22
22
1
/
22
1
/
22
i
=
1
i
=
1
ˆ
xy
=
ˆ
(
i
)
xy
xy
=
(
i
)
xy
≈
1
(11
.
6)
22
22
1
/
22
1
/
22
i
=
1
i
=
1
ˆ
(
i
)
yx
(
i
)
yx
yx
=
ˆ
yx
=
≈
1
.
yx
averaged over
22 sites on the local near-surface inhomogeneity. They are close to the normal
Figure 11.14 presents the apparent-resistivity curves ˆ
xy
and ˆ
N
-
curve characterizing the regional background (departure of ˆ
N
does not
exceed 12%). We can say that the averaging removes the geoelectric noise caused
by the
xy
,ˆ
yx
from
effect.
The potentials of statistical suppression of the
−
effect were clearly demon-
strated in the Baikal region (Berdichevsky et al., 1980). Here the apparent-resistivity
curves suffer severe local distortions due to near-surface intrusions and permafrost
lenses. The area under investigation is divided into vast zones I, II, III,
−
...
with con-
eff
−
formal
curves (Fig. 11.15a). Within each zone, the strong static shift covers 1,
2 or even 3 decades (Fig. 11.15b). The immediate inversion of all these chaotically