Information Technology Reference
In-Depth Information
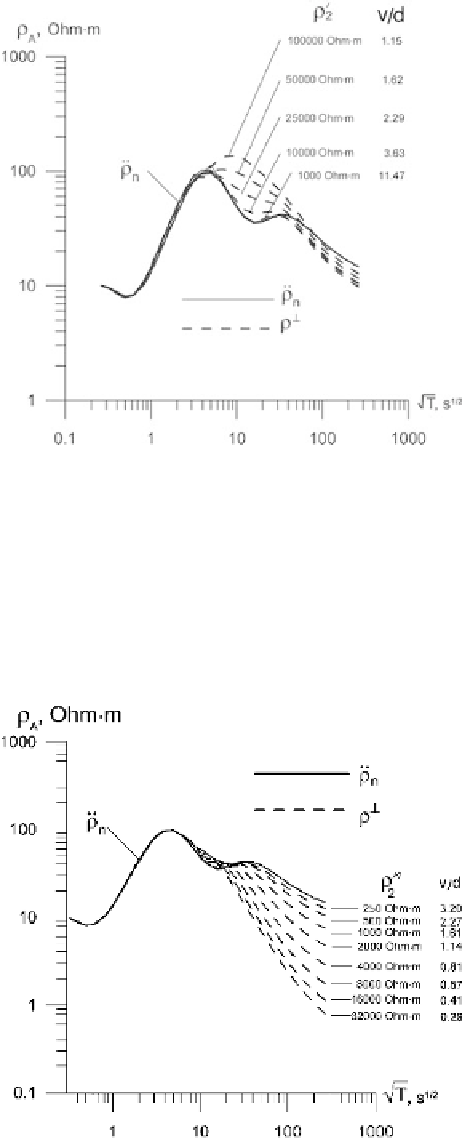
Fig. 8.8
The screening effect
in relation to the resistivity
2
of the layer overlapping the
crustal conductive zone
shown in Fig. 8.3. The
observation site is located at
the zone epicentre. Model
parameters:
1
=
10 Ohm
·
m
,
h
1
=
1km
,
2
=
h
2
=
1000 Ohm
·
m
,
19 km
,
h
2
=
15 km
,
c
=
10 Ohm
·
m
,
,
2
v
=
500 km
=
500 Ohm
·
m
,
h
2
=
65 km
,
3
=
10 Ohm
·
m
2
changes from 1000 Ohm
resistivity
d
runs from
11.47 to 1.15. Reasoning from Fig. 8.8, we establish three levels of screening: (1)
slight screening:
·
m to 100000 Ohm
·
m, the ratio
v/
v/
d
≥
10, (2) moderate screening:
v/
d
≈
2
÷
3
.
5 and (3) strong
screening:
1.
Figure 8.9 presents the transverse apparent-resistivity
v/
d
≤
⊥
-curves in the model
2
from Fig. 8.3 with half-width of the conductive prism
v
=
500 km and resistivity
of the underlying layer varying from 250 Ohm
·
m to 32000 Ohm
·
m. The observation
Fig. 8.9
The deep
S
-effect in
relation to the resistivity
2
of the layer underlying the
crustal conductive zone. The
model is shown in Fig. 8.3.
The observation site is
located at the zone epicentre
Model parameters:
1
=
10 Ohm
·
m
,
h
1
=
1km
,
2
=
2
=
·
,
1000 Ohm
m
h
2
=
19 km
,
h
2
=
15 km
,
c
=
10 Ohm
·
m
,v
=
500 km
,
h
2
=
65 km
,
3
=
10 Ohm
·
m