Information Technology Reference
In-Depth Information
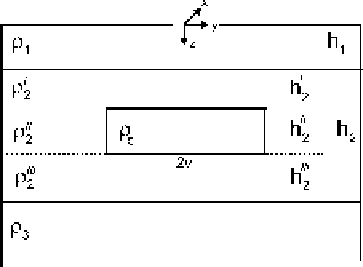
Fig. 8.3
Model of a
two-dimensional crustal
conductive zone:
1
- conductive sediments,
2
- resistive lithosphere,
c
- crustal conductive zone,
3
- conductive mantle
8.1.1 Magnetotelluric Anomaly Caused by Crustal
Conductive Zone
To gain a better insight into physical mechanisms of magnetotelluric anomaly
caused by the crustal conductive zone, we start our consideration with the field
profiles passing across the prism in the
y
−
direction. The electric and magnetic fields
E
x
,
E
y
,
H
y
obtained at
|
|
→∞
are normalized to the normal fields
y
.
profile, which vividly displays the peculiarities of
the TM-mode in a model with the wide conductive zone (
Figure 8.4 presents the
E
y
−
=
500 km). We recognize
here three effects conditioned by shunting action of the conductive prism:
- The current selects a path of the least resistance and flows from the resistive
2
−
layer. The near-surface current concentration aris-
inginregionsM
1
and M
3
manifests itself in side maxima of
E
y
developed on low
frequencies (
T
layer into the conductive
1
−
10000 s).
- The near-surface current flows from the conductive
=
1000
÷
layer into the con-
ductive prism. In region M
2
, the near-surface current deconcentration evolves. It
manifests itself in a vast central minimum of
E
y
developed over wide frequency
range (
T
1
−
10000 s).
- The deep current flows from the conductive
=
100
÷
layer into the conductive
prism. This effect decreases the near-surface current deconcentration. In region M
2
,
we observe a gentle maximum of
E
y
superimposed on the central minimum of
E
y
(
T
3
−
10000 s).
Quite different pattern is displayed by the TE-mode. Figure 8.5 presents the
E
x
- and
H
y
-profiles. The crusal conductive zone is reflected in the wide bowl-
shaped minimum of
=
100 s). With lowering frequency this minimum
flattens out. It practically vanishes at
T
E
x
(
T
=
10000 s, where effective penetration
depth
h
eff
is much greater than prism width 2
≥
). The
H
y
-profile
has more complicated appearance. Here the crustal conductive zone is reflected
in the gentle central maximum caused by excess current filling the prism and
in rather sharp side maxima and minima, which arise due to the horizontal
skin effect at the edges of the prism (
T
v
(
h
eff
>>
2
v
=
100 s). At lower frequencies the cen-
tral maximum increases, while the side extrema flatten out (
T
=
1000 s). But