Information Technology Reference
In-Depth Information
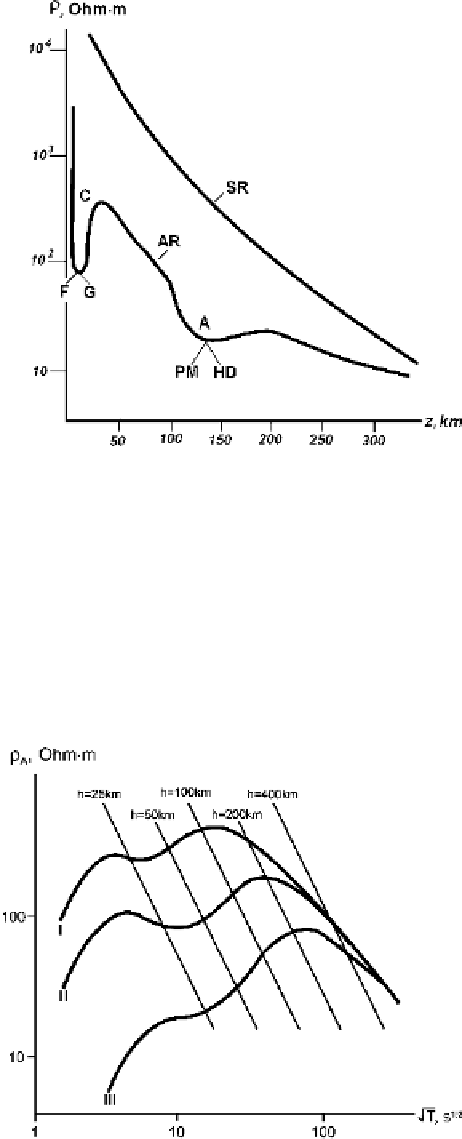
Fig. 8.1
Geoelectric
resistivity-depth profiles in a
tectonically stable and a
tectonically active region.
SR - stable (“cold”) region,
AR - active (“hot”) region;
C - zone of decreased
resistivity in the crust,
F - fluidization,
=
10
÷
250 Ohm
·
m,
G - graphitization,
=
m;
A - asthenospheric zone of
decreased resistivity,
PM - partial melting,
HD - hydrogen diffusity,
=
0
.
1
÷
100 Ohm
·
10
÷
50 Ohm
·
m
(Vanyan, 1977)
apparent-resistivity curves near the line
h
25 km. How do they display themselves
in two-dimensional and three-dimensional models?
A two-dimensional model of the crustal conductive zone is shown in Fig. 8.3. The
upper layer (
=
1
) simulates the conductive sedimentary strata underlaid with the resis-
tive lithosphere (
2
) resting on the highly conductive mantle (
3
). The lithosphere
2
,
2
,
3
), the
2
−
consists of three layers (
layer contains a conductive infinitely
long prism of resistivity
c
, its half-width is
v
. The prism runs in the
x
−
direction.
Fig. 8.2
One-dimensional
apparent-resistivity curves
over the crustal conductive
layer at a depth of 20 km;
h-lines for 25, 50, 100, 200,
and 400 km are shown.
I - sediments conductance
50 S, crustal conductive layer
conductance 100 S;
II - sediments conductance
100 S, crustal conductive
layer conductance 400 S;
III - sediments conductance
500 S, crustal conductive
layer conductance 1000 S
(Vanyan and Shilovsky, 1983)