Information Technology Reference
In-Depth Information
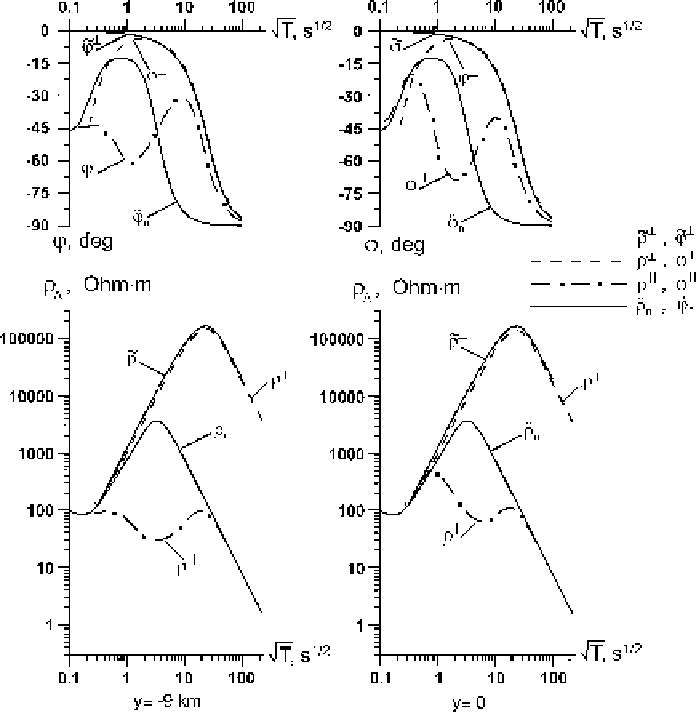
Fig. 7.19
Longitudinal and transverse apparent-resistivity and impedance-phase curves over the
resistive central segment in the model shown in Fig. 7.16;
y
-distance to the centre of the model;
˜
⊥
,
⊥
-analytical solution,
⊥
,
⊥
and
,
-solution by the finite elements method, ¨
˜
n
,
n
-
¨
1
,
1
locally normal solution. Model parameters:
=
1Ohm
·
m
,
h
1
=
1km
=
100 Ohm
·
m
,v
=
10 km
,
2
=
10000 Ohm
·
m
,
h
2
=
99 km
,
3
=
0
⊥
-curves
is slightly distorted, whereas their descending branch shifts drastically to the right.
And the
characteristic of the central segments. Here the ascending branch of the
-curves have a pronounced minimum (effect of false conductive layer),
while their descending branch is shifted to the right and comes close to the
⊥
-curve.
Figure 7.20 displays the tipper curves, which are antisymmetric with respect to
the midpoint of the central segment. At all frequencies the real tippers are positive
in the left part of the model and negative in its right part. At the same time the
imaginary tipper change their sign with frequency. The large tippers are observed
over the edges of the central segment (
|
|
≤
3km). They rather quickly attenuate
with distance from the central segment. Within the
h
-interval (
T
y
8000 s) the
real and imaginary tippers decay. With lowering frequency the tipper phases,
≥
=
W