Information Technology Reference
In-Depth Information
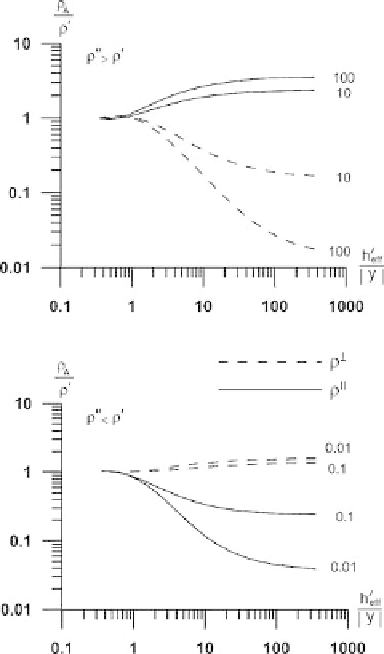
Fig. 6.2
Longitudinal and
transverse apparent-resistivity
curves in the
vertical-interface model.
Observation site is located
over the left quarter-space.
Curve parameter:
/
induction nature. But it is remarkable that in spite of the different physical nature,
both effects vanish at closely related distances. Distortions of the apparent resistiv-
ities
⊥
,
|
y
| ≈
.
25
h
eff
. Distortions of the phases
⊥
,
attenuate at
1
run to
3
h
eff
.
To gain a better insight into the physical nature of these distortions, we turn to
Figures 6.4 and 6.5, which show the
E
x
(
y
)
greater distances and attenuate at
|
y
| ≈
,
H
y
(
y
) and
E
y
(
y
)-profiles related to
E
x
,
the TE- and TM-modes. The fields
E
x
,
E
y
,
H
y
vary from the left normal fields
E
y
,
H
y
to the right normal fields
E
x
,
E
y
,
H
y
.
They are normalized to the right
normal field. Note that
E
N
x
E
N
E
N
y
E
N
H
N
y
H
N
=
x
,
=
y
,
=
y
.
E
x
1
/
1
to
E
x
is accounted for
by the mutual induction of the longitudinal excess currents. It consists of two zones.
Within the left (“conductive”) quarter-space we have a zone of the current concen-
tration. Within the right (“resistive”) quarter-space we have a zone of the current
deconcentration. The concentration and deconcentration zones manifest themselves
in the maximum and minimum of the transverse magnetic field
H
y
.Athighfre-
quencies, both the zones and the corresponding magnetic anomalies narrow in the
The smooth monotonous transition from
E
x
=