Information Technology Reference
In-Depth Information
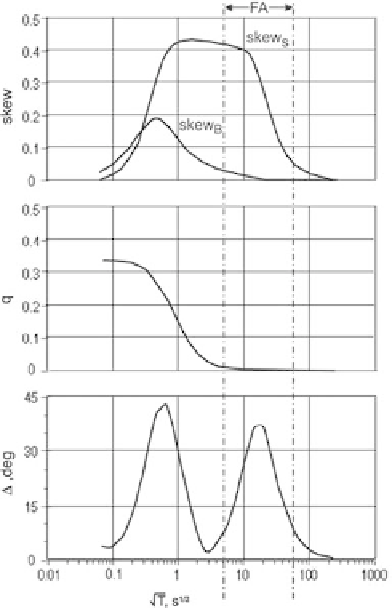
Fig. 3.6
Characteristic
parameters
ske
w
S
,
ske
w
B
,
,
q
for the
superimposition model
shown in Fig. 1.11; FA - area
favorable for
LR-decomposition
⊥
of
the longitudinal and transverse regional impedances as well as the deflection angles
x
and
Figures 3.7 and 3.8 present the regional strike angle
R
, the phases
and
y
determined by Bahr's formulae. Within the favorable area FA the scatter
15
◦
6
◦
, whereas outside the area FA it reaches 45
◦
in
R
varies from 10
÷
to 3
÷
and
⊥
3
◦
even more. The scatter in
does not exceed 2
÷
(even outside the area FA),
15
◦
3
◦
. The scatter in
whereas the scatter in
varies from 10
÷
to 2
÷
x
and
y
is
10
◦
within the area FA and increases to 15
◦
outside this area.
Figures 3.9 and 3.10 presents the regional strike angle
about 5
÷
⊥
of the longitudinal and transverse regional impedances as well as the twist and shear
angles
and
, the phases
s
determined by means of Groom-Bailey's least squares fitting pro-
cedure. Outside the favorable area FA the scatter in
t
and
R
ranges up to 30
◦
, however
7
◦
. The scatter in phases is about 3
◦
for
⊥
and 3
7
◦
within this area it drops to 5
÷
÷
. The scatter in
s
is about 3-8
◦
within the favorable area and increases
for
t
and
30
◦
outside this area. Comparing the Bahr and Croom-Bailey decomposi-
tions, we see that Groom-Bailey's least squares fitting procedure provides more
stable results that Bahr's analytical formulae.
It would be natural to combine the Bahr and Groom-Bailey techniques. It seems
that the efficient separation of local and regional effects should consist of two
stages. In the initial stage we have to choose frequencies favorable for local-regional
to 25
÷