Information Technology Reference
In-Depth Information
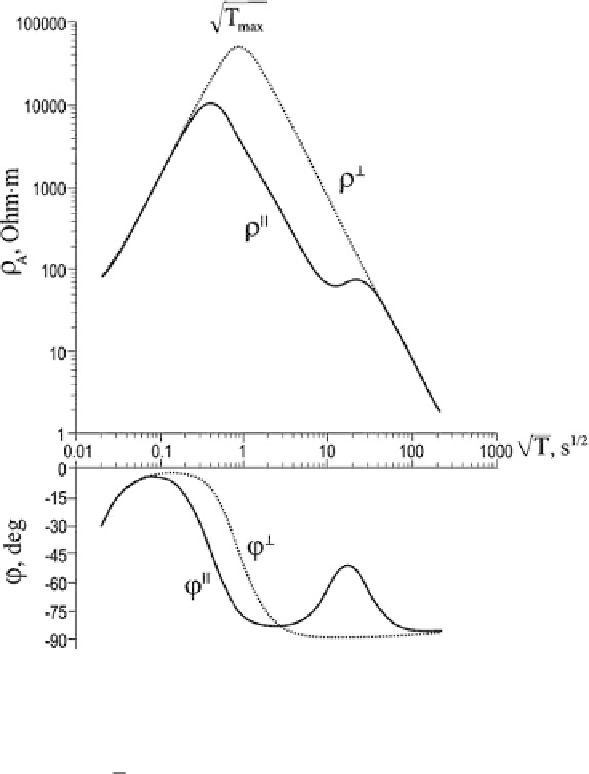
Fig. 3.5
Longitudinal and transverse apparent-resistivity and impedance-phase curves computed
from the two-dimensional regional impedance; the superimposition model is shown in Fig. 1.11
(0.1 s
1/2
<
√
T
<
10 s
1/2
) the axial symmetry is violated by the regional structure,
so that
skew
S
ranges up to about 0.4. An incre
as
e in
skew
S
is accompanied by an
increase in
skew
B
which reaches its peak at
√
T=0.5s
1/2
and then tends to zero
indicating the attenuation of local induction effects. Small values of
skew
B
correlate
with a drop in parameter
q
, which indicates the decay of loc
al
magnetic distor-
tions. With small
skew
B
and
q
we choose an area 5 s
1/2
<
√
T
<
60 s
1/2
, where
varies from 7.5
◦
to 35
◦
. This area is most favorable for the
local-regional decomposition. Coming back to Fig. 3.5, we see that the favorable
area begins with
T
the phase difference
≈
⊥
−
25
T
max
where
T
max
is a period for the maximum of the
curve.
The Bahr and Groom-Bailey decompositions were carried out against random
noises with standard deviation of 5% in the impedance amplitudes and 3
◦
in the
impedance phases.