Information Technology Reference
In-Depth Information
123456789 0 1 2 3 4
-30
arg
2
-45
-60
arg
1
-75
arg , deg
B
TV
90
α
1
60
30
α
2
0
1 2 3 4 5 6 7 8 9 1011121314
observation sites
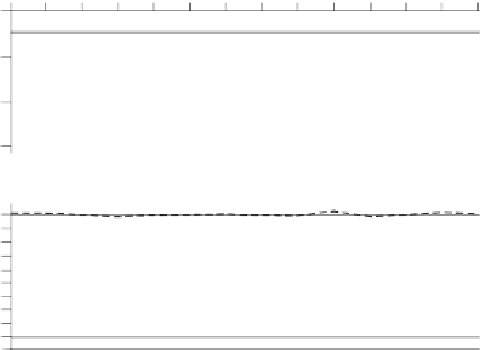
Fig. 3.2
Phases arg
2
of the principal values of the regional two-dimensional impedance
[
Z
R
] and its principal directions
1
,
arg
-shaped near-surface
resistive inclusion and a 2D deep regional conductive prism shown in Fig. 2.3; B - Bahr method,
TV - true value;
T
= 640 s
1
,
2
in a superimposition model with a
Now we would like to illustrate the potentialities of the Bahr method. Let us
return to the three-layered (3D+2D)-superimposition model with a local
-shaped
resistive inclusion in the sediments and a regional two-dimensional prismatic con-
ductor in the resistive lithosphere (Fig. 2.3). At
T
= 640 s we have
ske
w
B
<
0
.
1 and
30
◦
. These conditions favour the local-regional decomposition. Figure 3.2
displays the phases
|| ≈
2
of the principal values of the regional
two-dimensional impedance [
Z
R
] and its principal (transverse and longitudinal)
directions,
1
=
arg
1
,
2
=
arg
are
defined with an accuracy of 1-3
◦
and 1-2
◦
respectively. Figure 3.3 shows the chart
of the unit electric fields
e
(y)
plotted by means of Bahr's method. We see here a
typical picture of currents flowing around a near-surface resistive inclusion.
1
and
2
, deduced by the Bahr method. We see that arg
and
x
y
Fig. 3.3
Chart of the unit
electric fields
e
(
y
)
in a
superimposition model with a
-shaped near-surface
resistive inclusion and a 2D
deep regional conductive
prism shown in Fig. 2.3;
T
= 640 s