Geoscience Reference
In-Depth Information
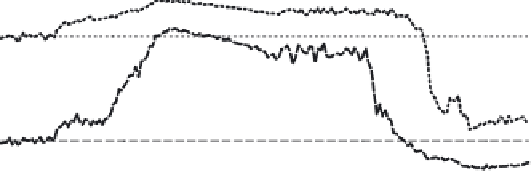
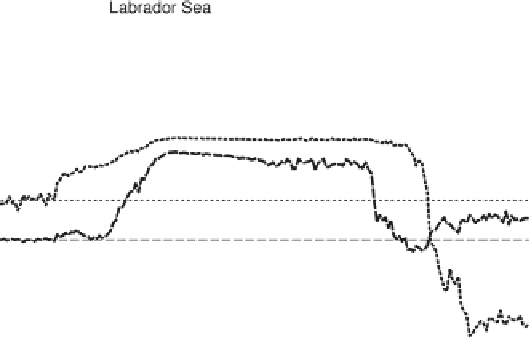
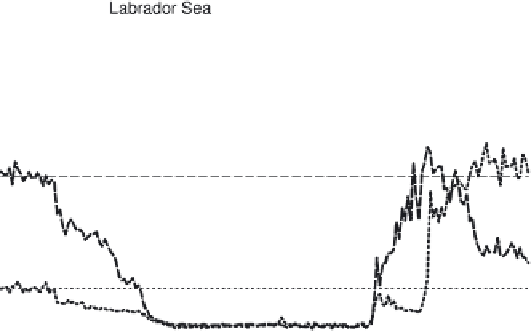
Figure 12.
flux (SHF), and (c) maximum mixed layer
depth (XMXL). Dashed and dotted lines represent regional mean values for the Labrador Sea and GIN seas, respectively.
(a) Annual mean sea ice concentration (AICE), (b) surface heat
layers during stage 2 (Figure 9b) induces sea ice retreat (Fig-
ure 12a) and an abrupt shift in SHF (Figure 12b). Only after
that, do deep convection (Figure 12c) and NADW formation
(Figure 1) resume in the GIN seas. Meanwhile, the GIN seas
steric and deep-pressure difference resume a little during
stage 1 and then more robustly during stage 2 (Figure 13,
shaded line). During stage 2, the relevant variables in the GIN
seas can be seen to undergo an extreme shift and are enhanced
above initial glacial values by a factor of 2 or more in many
cases (Figures 11
a strong reinitiation of NADW formation (Figure 1, light
shaded line) and saltier/denser water in the GIN seas (Figures
9a and 10b). The denser water in the GIN seas at end of
stage 2 contributes to the persistence of the AMOC overshoot
and the mean state transition of AMOC (Figure 1, black line).
Among three factors, which promote NADW formation in
the Labrador Sea and GIN seas, contributions of two factors
signi
cantly decrease or disappear at the end of each stage.
One is the contribution of salinity advection, which is based
on the salinity difference between the advected salty water
-
13, shaded line). All These changes cause


Search WWH ::

Custom Search