Geoscience Reference
In-Depth Information
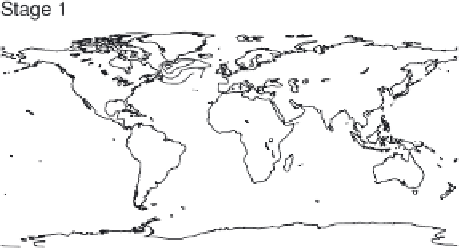
Figure 4.
Change in annual mean surface air temperature (SAT) during (a) stage 1 and (b) stage 2. Units are in degrees
Celsius (°C).
Figure 5.
Change in (top) annual mean salinity (S), (middle) potential temperature (T), and (bottom) potential density (PD)
during (left) stage 1 and (right) stage 2 in the zonal averaged Atlantic section.


Search WWH ::

Custom Search