Geoscience Reference
In-Depth Information
Because of our lack of understanding of the dominant
processes underlying past shifts in the AMOC and the in-
creasing research interest in global warming in the past
[Carlson et al., 2008; Milne and Mitrovica, 2008; Barker et
al., 2009; Liu et al., 2009], a detailed investigation of the
processes controlling AMOC recovery during the last degla-
ciation is still needed. TraCE-21000 simulation provides a
basis to address this issue [Liu et al., 2009]. This simulation
focus on a historic global warming period (last deglaciation)
and its results should be helpful to understand the more
general processes controlling AMOC variation and to project
the future behavior of possible AMOC changes under current
and projected global warming.
In this study, we investigate the recovery process of
AMOC during BA onset in TraCE-21000 simulation, em-
phasizing the processes underlying the reinitiation of NADW
in its two origins. A detailed analysis of surface and subsur-
face variables provides a framework for discussing the dif-
ferent stages involved in the AMOC recovery process. A
description of the model and simulation setup is given in
section 2. The two-stage feature of AMOC recovery is pre-
sented in section 3, while the processes underlying the re-
covery stages are discussed in section 4. Discussion and
conclusions follow in section 5.
parallel runs DGL-A and DGL-B with different experimental
schemes. Compared with DGL-B run, the DGL-A run more
successfully represented global climate evolution according
to reconstructed paleoclimate proxies (sea surface level,
AMOC intensity, surface air temperature (SAT) in Antarctica
and Greenland, and sea surface temperature (SST) in the
tropical Atlantic Ocean) through a sudden termination of
meltwater discharge into the North Atlantic at 14.67 ka.
During the integration of the DGL-A run, external forcing
such as meltwater discharge, insolation intensity, greenhouse
gas (GHG) concentration, and land
-
ice sheet topography all
varied in time based on reconstructed data [Liu et al., 2009].
The key factor for the successful transient simulation is
setting the scenario of meltwater discharge in high North
Atlantic latitudes (50°
70°N) and the Gulf of Mexico from
19 to 14.67 ka. The total meltwater discharge is equivalent to
a 50.1 m rising of the global sea level (the North Atlantic and
Gulf of Mexico contribute 45.35 m and 4.75 m, respectively).
The mean intensity of meltwater discharge is about 0.133 Sv.
In the DGL-A run, AMOC is suppressed to a
“
turned off
”
state during Heinrich 1(H1) event (17 ka) with the increasing
meltwater discharge into North Atlantic, and the
-
“
turned off
”
2. MODEL AND EXPERIMENTAL SETUP
The CGCM used in this study is the National Center for
Atmospheric Research (NCAR) CCSM3 with a dynamic
global vegetation module. CCSM3 is a global, coupled
ocean
-
atmosphere
-
sea ice
-
land surface climate model with-
out flux adjustment [Collins et al., 2006]. The atmospheric
model is the Community Atmospheric Model 3 (CAM3)
with horizontal resolution of about 3.75°
3.75° and 26
vertical hybrid coordinate levels. The land model is the
Community Land Model version 3 (CLM3) with the same
resolution as the atmosphere. The ocean model is the NCAR
implementation of the Parallel Ocean Program (POP) with
vertical z coordinate with 25 levels. The longitudinal resolu-
tion is 3.6°, and the latitudinal resolution is variable, with
finer resolution in the tropics. The sea ice model is the NCAR
Community Sea Ice Model (CSIM). The resolution of CSIM
is identical to that of POP. CCSM3 has previously been
widely used in equilibrium and transient simulations of the
glacial/interglacial climate state [Shin et al., 2003a; Otto-
Bliesner et al., 2006; Hu et al., 2007, 2008; Liu et al.,
2009; Renold et al., 2009].
TraCE-21000 is the first try at representing the transient
evolution of Earth
'
s climate system over the last 21,000 years
with the low-resolution version (T31_gx3v5) of CCSM3
[Liu et al., 2009]. TraCE-21000 simulation includes two
Figure 1.
Two-stage feature of AMOC recovery (solid line) based
on regional NADW formation volumes in the Labrador Sea
(dashed line) and the GIN seas (dotted line) of model run DGL-
A. AMOC intensity is de
ned as the maximum stream function of
the Atlantic section below depths of 500 m. Regional NADW
formation volume in the GIN seas is de
ned as the maximum
stream function at its southern edge at 62°N. Regional NADW
formation volume in the Labrador Sea is de
ned as the difference
of AMOC intensity and regional volume in the GIN seas. Circles
show the time of four climate states: the glacial state (GLA, 19 ka
B.P.), pre-BA event (pre-BA, 14.67 ka B.P.), recovery (REC,
14.49 ka B.P.) and BA (14.32 ka B.P.). Horizontal dashed lines
stand for the Last Glacial Maximum value of AMOC intensity and
NADW formation volume in the Labrador Sea and GIN seas.
Time periods of the two recovery stages are shown with
“
stage 1
”
(pre-BA
(REC-BA). Inset plot shows the
latitude edges of each NADW region used to calculate regional
NADW formation.
-
REC) and
“
stage 2
”


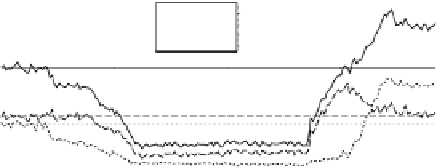


Search WWH ::

Custom Search