Geoscience Reference
In-Depth Information
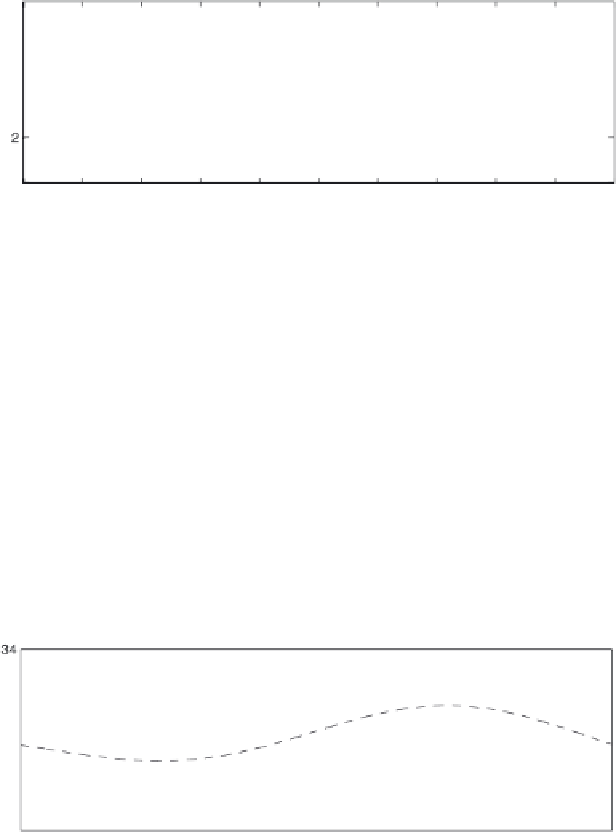
Figure 7.
Two independent realizations of the last 25,000 years and an ensemble average (third plot from top) of 10
realizations (one standard deviation intervals are shown in lighter traces) modeled with SIO. The insolation curve is the
summer monthly mean at 65°N from the work of Laskar et al. [2004]. The effect of melting of the ice sheets is added to the
model assuming it responds linearly by warming at the same rate ice volume decreases. After ice volume reaches its
Holocene value, this forcing is kept constant for all subsequent times.
ed mod-
els, all questions concerning the mechanisms by which heat
is transferred in the ocean are still difficult to answer. We can
speculate that the state of the model ocean just before each
abrupt warming is a relatively weak AMOC and a water
column with cold fresh layers overlying warm salty (albeit
denser) layers (Figure 2). This ocean column preconditioning
However, despite our enthusiasm for the simpli
process (labeled M in Figure 2) begins as sea ice reaches its
maximum extent, and the deep ocean rapidly first and then
slowly becomes warmer and saltier from the heat and salt
advected north from lower latitudes and the tropics. This
slowly builds up the water column instability [Stern, 1975]
until, in time (centuries or millennia), a sudden eruption of
raising plumes of heat and salt ensues, the AMOC abruptly


Search WWH ::

Custom Search