Geoscience Reference
In-Depth Information
stricted to the earlier part of MIS 6. However, the two older
cooling events within MIS 6e had no major impact on the
water column structure, and the nearly
flat G. truncatuli-
18
O record indicates that conditions must have been
similar to the ones of the penultimate glacial maximum
(Figure 7b). In the ENACW
st
, the most pronounced changes
occurred between 153 and 161 ka, when ventilation was
reduced, and G. truncatulinoides
δ
noides
δ
18
O values were lower. It
needs to be seen in the future if these lighter
18
O values
were a temperature and/or salinity signal. Overall, the same
picture as for the previous glacial periods emerges with the
southern area being strongly affected by subtropical waters
and the Azores Front located nearby. This clearly indicates
that this pattern is a robust feature independent of the overall
climate forcing.
δ
7. IMPRINTS THROUGHOUT THE WHOLE
WATER COLUMN
As mentioned in the introduction, the impacts of the abrupt
climate change events can be traced down into the interme-
diate and deep water levels. To emphasize this, records from
cores off the Sines coast or in the Gulf of Cadiz are combined
in Figures 8 and 9. The hydrographic evidence for the last 65
kyr is based on planktic and benthic foraminifer
18
O data,
the mean grain size as evidence for MOW variability and
deep-water temperature (DWT) records. Ventilation status
(Figure 9) is assessed from planktic and benthic
δ
13
C records.
δ
7.1. Hydrography
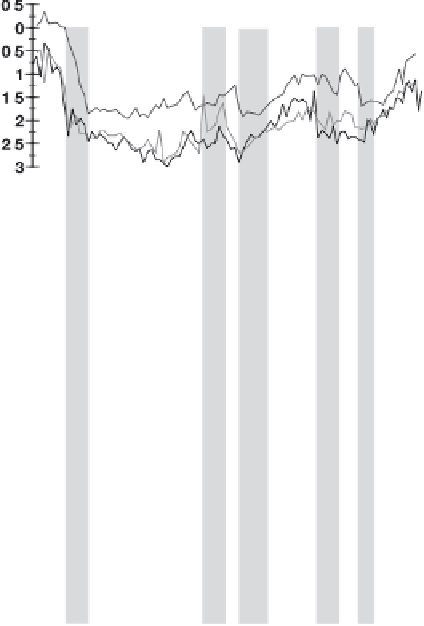
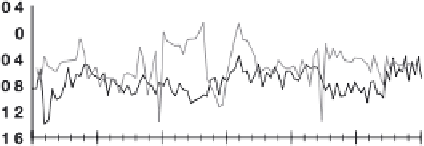
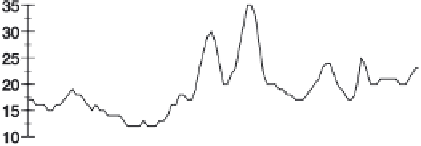
Figure 7.
Vertical gradients in the upper water column at site
MD01-2443 during MIS 6 (this study). (a) The
δ
18
O records of G.
ruber white (dark gray, Grw); G. bulloides (black, Gb), and N.
pachyderma (r) (light gray, Npr). (b) The
δ
The records clearly show that the Greenland-type millennial-
scale variability impacted the entire water column from the
sea surface down to 2465 m, i.e., the water depth of site
MD01-2444. The planktic foraminifer records all show
warming (interstadial) and cooling (stadial) cycles that were
contemporary in the water depths from 0 to 400 m with
similar amplitudes in the G. bulloides (Figure 8c) and G.
truncatulinoides (Figure 8d) records and a smaller amplitude
in the G. ruber white data (Figure 8b). The G. truncatuli-
noides data of core MD99-2336 from the southern Portu-
guese margin (gray lines in Figure 8d) even indicate the
presence of subtropical ENACW in the region during Hein-
rich stadials 1 and 6 in accordance with nannofossil evidence,
i.e., maxima of the subtropical, deep-dwelling coccolitho-
phore Florisphaera profunda [Colmenero-Hidalgo et al.,
2004; Incarbona et al., 2010]. The presence of G. ruber
white during these periods (Figure 8b) even points to the
presence of subtropical surface waters [Voelker et al., 2009].
The stadial/interstadial cyclicity is also recorded in the
MOW strength (Figure 8e) with enhanced bottom current
18
O record of deep-
dweller G. truncatulinoides (r) (Gtr). (d and e) Respective
δ
13
C
values. (c) Magnetic susceptibility record with peaks (also marked
by gray bars) indicating ice-rafting events. Numbers refer to MIS
substages; H11 is Heinrich event 11.
oscillations marked the beginning of MIS 6 (177
-
188 ka,
Figure 6d). In particular, the interval from 158.9 to 163 ka
was associated with higher abundances of N. pachyderma (s)
(Figure 6c), the presence of IRD [de Abreu et al., 2003], and
a reduced tree cover on land [Margari et al., 2010] support-
ing relative harsher climate conditions.
As described for the previous glacial periods, conditions
on the southwestern Iberian margin were more stable (Fig-
ure 7). The G. truncatulinoides
δ
18
O record shows hardly
13
C values indicate a well-
ventilated ENACW
st
(Figure 7d), in contrast to the subtrop-
ical surface waters reflected in the G. ruber white
δ
any change, and the respective
δ
13
C
values. Millennial-scale oscillations were limited and re-


Search WWH ::

Custom Search