Geoscience Reference
In-Depth Information
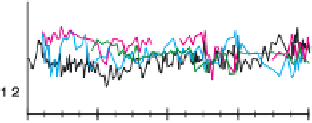
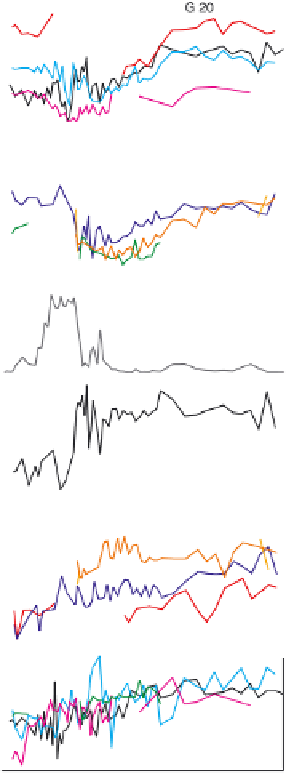
Plate 1.
Vertical gradients in the upper water column at site MD95-2040 during MIS 2 [Voelker et al., 2009] and 4 [de
Abreu et al., 2003; this study]. (a) The
δ
18
O records of surface to thermocline dwelling species Globigerinoides ruber
white (red, Grw), G. bulloides (black, Gb), N. pachyderma (r) (cyan, Npr), and N. pachyderma (s) (magenta, Nps). (b) The
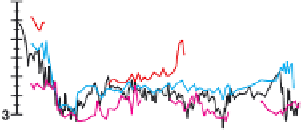
δ
18
O records of winter mixed layer species Globorotalia inflata (dark blue, Gi) and deep dwellers Globorotalia scitula
(green, Gsc), Globorotalia truncatulinoides (r) (light orange, Gtr) and G. truncatulinoides (s) (dark orange, Gts; only MIS 4).
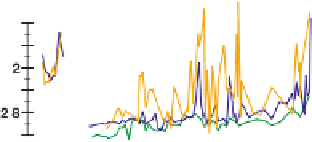
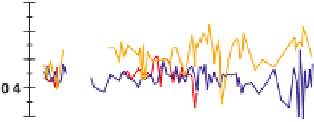
(e and f ) Respective
δ
18
Oof
G. bulloides reflecting seasonality. Blue bars and H1, H2a, H2b, H3, and H6 mark the respective Heinrich stadials. GI
indicates respective Greenland interstadial.
13
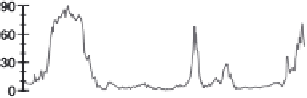
C values. (c) Percent N. pachyderma (s) data. (d) Difference between
δ
18
OofG. inflata and
δ
The percent N. pachyderma (s) and SST
su
records of core
MD95-2040 clearly indicate that glacial MIS 6 differed not
only in absolute values but also in the intensity (percent N.
pachyderma (s); SST) of the abrupt climate change variabil-
ity as previously described by de Abreu et al. [2003]. MIS
6 percent N. pachyderma (s) values in core MD95-2040 are
comparable to the levels recorded in the cores off Sines
during the last glacial cycle, meaning SST were significantly
warmer. Although hampered by a data gap, the same can be
said for the Sines area where percent N. pachyderma (s) values
were about half of those of core MD95-2040 (Figure 5d),
especially during Heinrich event 11, and more in the range


Search WWH ::

Custom Search