Geoscience Reference
In-Depth Information
18
O record of core
MD95-2041, located closer to the coast (Figure 1a), differs
from the one of MD95-2042, especially during MIS 3, with a
less clear imprint of Greenland stadial and interstadial cycles.
Thus, at site MD95-2041, a different hydrographic signal
was recorded. The
In summary, the core transect along the western Iberian
margin reveals that during the Heinrich and Greenland stadials
of the last 80 kyr, SST increased from north to south by about
1°C along with latitudinal shifts of about 1°. During Heinrich
events, SST
su
minima were around 4°C between 42°N and 43°
N, near 6°C at 40.6°N, between 8°C and 9°C near 38°N, and
near 10°C at 36°N. The Polar Front was most likely located
near 41°N and the (Sub)Arctic Front with the atmospheric
Polar Front at about 39°N. In accordance with the temperature
gradients and frontal positions, climate conditions were more
severe in the north than in the south with subsequent impacts
on the vegetation [Fletcher et al., 2010; Naughton et al., 2009;
Roucoux et al., 2005; Sánchez-Goñi et al., 2008].
MD95-2041 (Figure 4). The G. bulloides
δ
13
C and SST records further support this.
Site MD95-2041 experienced a much higher SST
su
variabil-
ity with frequent short to longer-lasting coolings in the range
of 3°C to 6°C between the Heinrich stadials (Figure 4e), a
variability that persists in relation to the higher-resolution
SST
Aug
record of Sánchez-Goñi et al. [2008] for core MD95-
2042 shown in Figure 3. Along with the colder SST,
G. bulloides
δ
13
C values are generally higher at site MD95-
2041 than at MD95-2042 (Figure 4c). If one excludes tem-
perature [Bemis et al., 2000] as cause, the difference would
indicate that nutrient concentrations were lower in the near-
shore waters. Fewer nutrients together with the SST vari-
ability indicate that site MD95-2041 experienced periods of
intense upwelling in the intervals between the Heinrich sta-
dials with the associated high surface water productivity
δ
5.2. Longitudinal Differences off Sines 38°N: The Upwelling
Influence
The above-mentioned upwelling system dynamics that
might drive regional variability off the Sines coast can best
be seen by comparing the records of cores MD95-2042 and
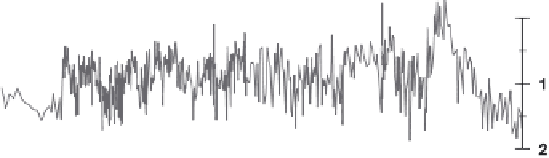
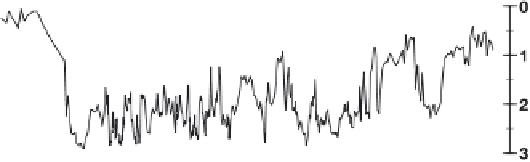
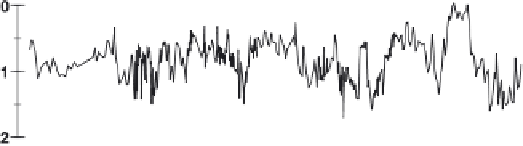
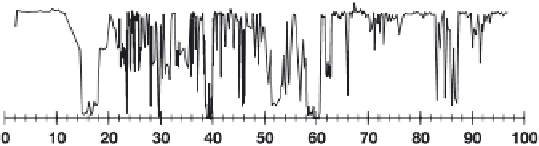
Figure 4.
Longitudinal gradients in surface water properties off Sines between offshore site MD95-2042 (10.17°W, gray
lines [Cayre et al., 1999; Shackleton et al., 2000] SST [Salgueiro et al., 2010]) and nearshore site MD95-2041 (9.52°W,
black lines) [Voelker et al., 2009, this study]. (a and b) Respective Globigerina bulloides
18
O records and (c and d) G.
δ
13
C records with the gray shading in Figure 4c representing the offset between the two records. (e) Respective
foraminifer-based summer SST records. H1 to H8 mark Heinrich stadials 1 to 8, and GI indicates Greenland interstadials.
bulloides
δ


Search WWH ::

Custom Search