Geoscience Reference
In-Depth Information
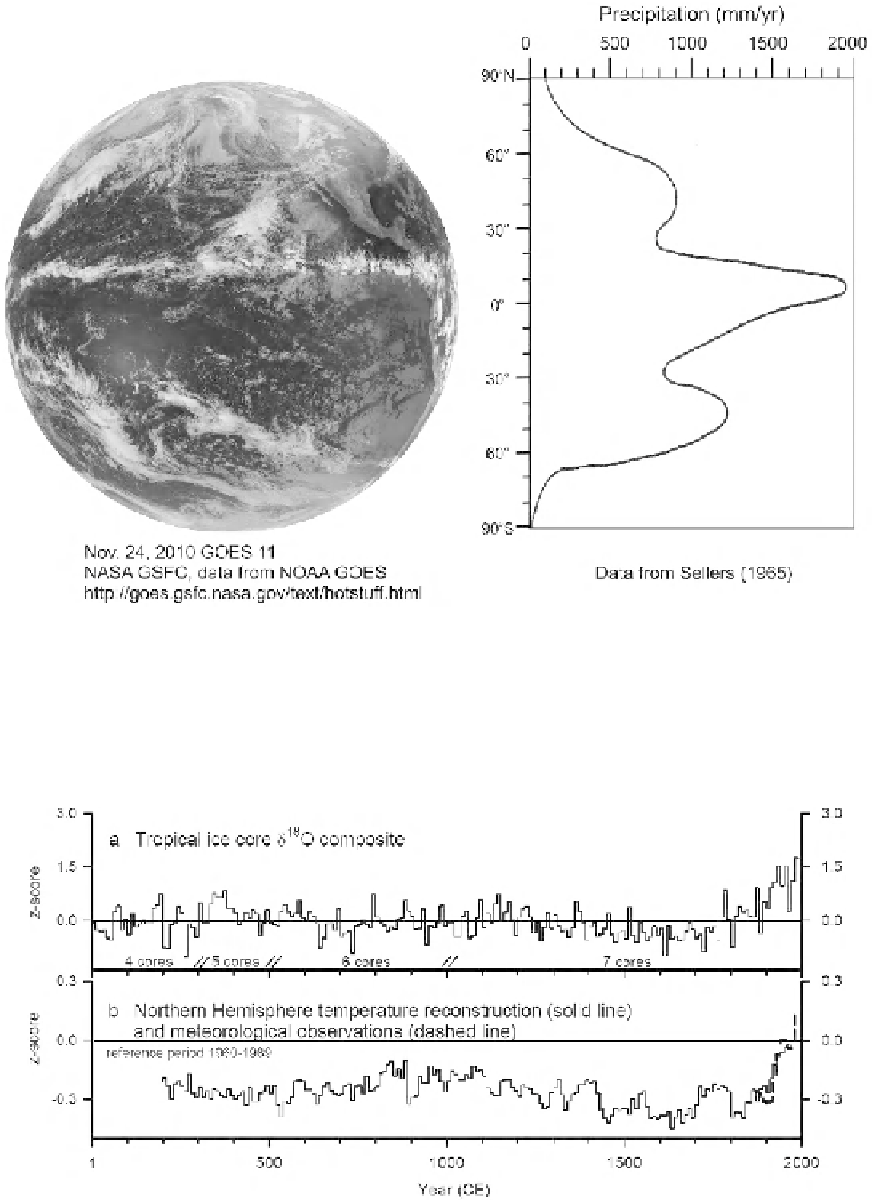
Figure 6.
GOES 11 satellite image of the Pacific Ocean basin on 24 November 2010 showing the Intertropical
Convergence Zone cloud band in the equatorial Pacific. The deep tropics are also the region of highest precipitation
(source of data and time represented) because of the rising of warm, moist air and latent heat release in the region of the
500 mbar level. The zonally averaged precipitation is shown on the right [after Sellers, 1965].
Figure 7.
(a) The 2000 year record of temperature variations reconstructed from an array of tropical ice cores from the
Andes and the Tibetan Plateau [Thompson et al., 2006a]. (b) Reconstructed temperature records [Mann and Jones, 2003]
from a variety of proxy data over a comparable time period, overlain by meteorological data [Jones and Moberg, 2003]
since the midnineteenth century.


Search WWH ::

Custom Search