Geoscience Reference
In-Depth Information
3. PALEOTEMPERATURE VARIABILITY
IN ATLANTIC
4. SUBPOLAR ATLANTIC VARIABILITY OF
PALEOTEMPERATURE AND SALINITY
First, we investigate the millennium variability at three
sites of the Atlantic characterizing the subpolar and subtrop-
ical gyres. Figure 2 shows the data and their wavelet decom-
positions for (1) the deep water of the subpolar gyre in the
Nordic Seas, (2) off the coast of West Africa, and (3) in the
Cariaco Basin, which characterize the subtropical gyre. We
see the presence of the 1500 year signal in both subpolar and
subtropical gyres.
However (Figure 3), the 1500 year signal is almost invis-
ible in the Greenland temperature, and it is only slightly
expressed in the Greenland Na ion record, which charac-
terizes the wind conditions over Greenland [Mayewsky et
al., 2004]. The sunspot reconstruction record (Figure 3,
bottom) does not display 1500 year quasiperiodicity at all,
thus con
To investigate the variability in the North Atlantic in
more detail, we complement the temperature data used in
Figure 2 with the salinity data from the same site and with
the surface temperature and salinity reconstructions (Fig-
ure 4) made by Thornalley et al. [2009]. Figure 5 shows
the wavelet decomposition of these data. The wavelets of
salinity and temperature display a nonstationary 1500 year
variability. We see also more powerful variations at about
3000 years.
The EMD method, which is adaptive to the data, permits a
better investigation of evolution of the modes with frequency
bands in the vicinity of 1/1500 year frequency. Figure 6
shows the time evolution of the modes. We see again that
the oscillations with the quasiperiods close to 1500 year are
highly nonlinear. These
finding by Debret et al. [2007] and
Dima and Lohmann [2009]. We conclude that the solar
forcing does not
rming the
findings imply a nonlinear mecha-
nism of excitation of the oscillations.
A combination of data sets for temperature and salinity
allows us to investigate their joint probability distributions.
“
directly
”
drive the 1500 year climate
variation.
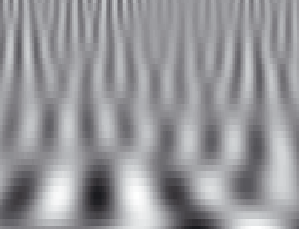
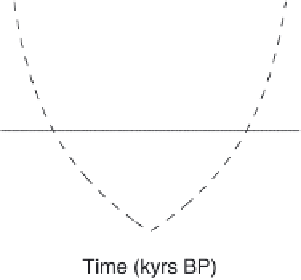
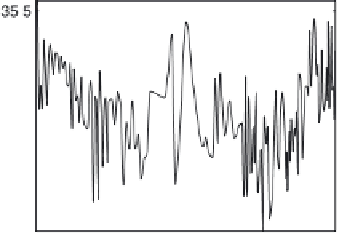
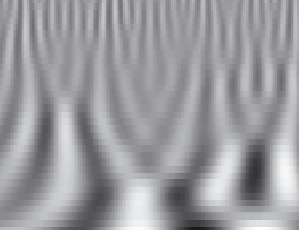
Figure 4.
(left) Temperatures reconstructed and interpolated with 20 year steps for the Globigerina bulloides (T
b
), which
characterize the ocean surface conditions, and Globorotalia (Tinf),
ata (T
inf
), which characterize the conditions at the
thermocline depth of the ocean at 62.05°N, 17.49°W [Thornalley et al., 2009]. (right) Wavelet decompositions of data
shown in Figure 4, left. The solid horizontal line marks the 1500 year period. The dashed line outlines the 90% statistical
signi
cant part (inside the cone).


Search WWH ::

Custom Search