Geoscience Reference
In-Depth Information
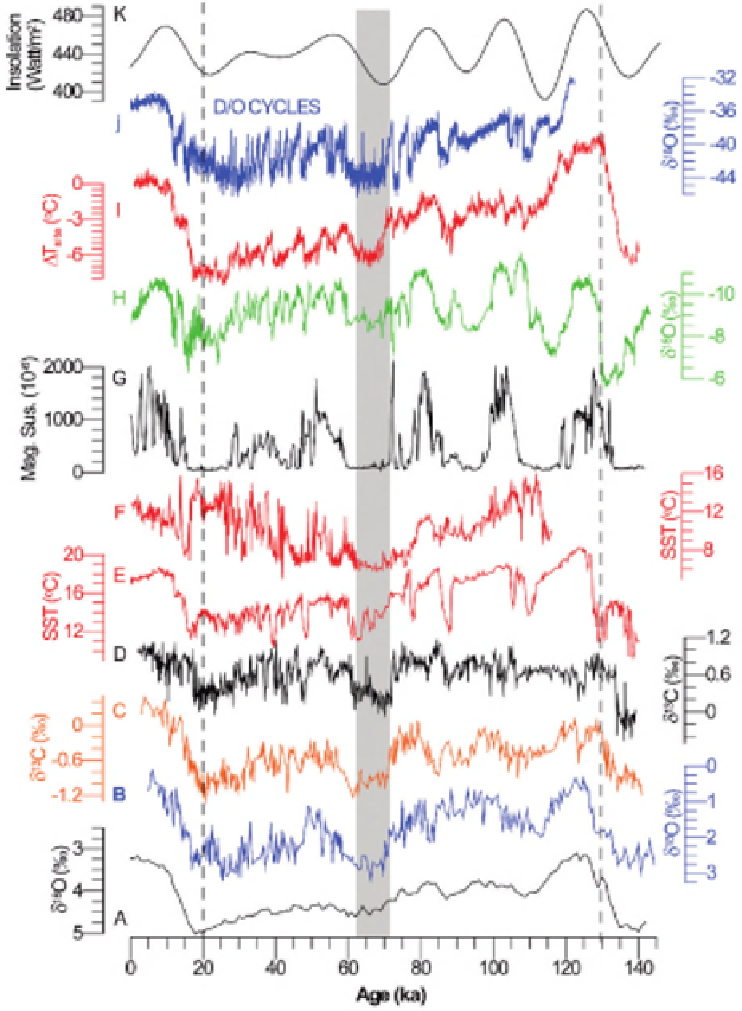
Figure 2.
Comparison of various proxy records that demonstrate abrupt climate changes during the last glacial cycle. (a) Global stack of
benthic foraminiferal oxygen isotopes (
δ
18
O in planktonic foraminifera Globigerina bulloides
from the North Atlantic Integrated Ocean Drilling Program Site 1313 (H. Rashid, unpublished data, 2011). (c and d) Carbon isotopes (
δ
18
O) [Lisiecki and Raymo, 2005]. (b) The
δ
13
C)
in benthic foraminifera Cibicidoides wuellerstorfi from the South Atlantic Ocean Drilling Program Site 1089 [Charles et al., 2010] and core
MD97-2120 from the SW PacicOcean[Pahnke and Zahn, 2005], respectively. (e and f ) Alkenone (U
K
37
) derived sea surface
temperatures from the NE Atlantic core MD01-2443 [Martarat et al., 2007; Voelker and de Abreu, this volume, Figure 5] and core
MD01-2412 from the NW Pacific Ocean [Harada et al., 2008], respectively. (g) Magnetic susceptibility record from Lake El
'
gygytgyn, NE
Siberia [Nowaczyk et al., 2007]. (h) The
δ
18
O in the Shanbao speleothems, NE China [Wang et al., 2008]. (i) Antarctic temperature
reconstructed from the deuterium content ((
Δ
T) elevation corrected) in the Eastern Droning Maud Land facing the South Atlantic [Stenni et
al., 2010]. (j) The
δ
18
O in the North Greenland Ice Core Project ice core with a revised chronology [Svensson et al., 2008]. (k) June
insolation at 65°N [Berger and Loutre, 1991]. All records are plotted according to their independent age models. Note that the vertical grey
bar indicates the duration of marine isotope stage 4 and the two vertical discontinuous lines indicate the 20 and 130 ka time horizons.


Search WWH ::

Custom Search