Graphics Programs Reference
In-Depth Information
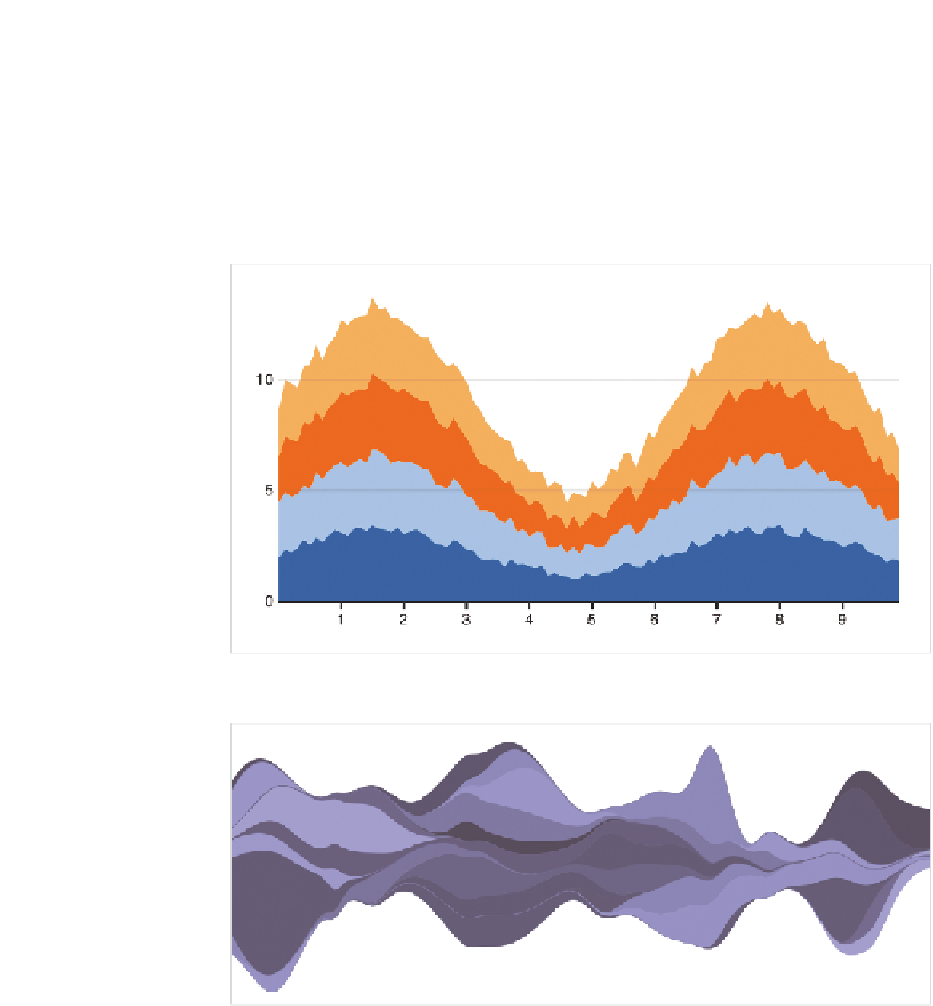
geometrically speaking. Figure 3-15 shows a stacked area chart, which
can be interactive.
This chart type is built into the Protovis, but you can also go with a less
traditional streamgraph, as shown in Figure 3-16.
FIGurE 3-15
Stacked area chart with Protovis
FIGurE 3-16
Custom-made streamgraph with Protovis
You can also easily use multiple libraries for increased functionality.
This is possible in Flash, but JavaScript can be a lot less heavy code-
wise. JavaScript is also a lot easier to read and use with libraries such

Search WWH ::

Custom Search