Graphics Programs Reference
In-Depth Information
use largely depends on what your goals are for a speciic data graphic and
what you're most comfortable with.
Some people stick with one language and get to know it well. This is ine,
and if you're new to programming, I highly recommend this strategy.
Familiarize yourself with the basics and important concepts of code.
Use the language that best suits your needs. However, it's fun to learn new
languages and new ways to play with data; so you should develop a good
bit of programming experience before you decide on your favorite solution.
PyThoN
The previous chapter discussed how Python can handle data. Python is
good at that and can handle large amounts of data without crashing. This
makes the language especially useful for analyses and heavy computation.
Python also has a clean and easy-to-read syntax that programmers like,
and you can work off of a lot of modules to create data graphics, such as
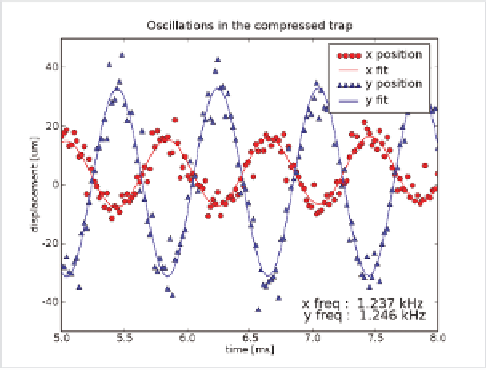
the graph in Figure 3-11.
From an aesthetic point of view, it's not great. You probably don't want to
take a graphic from Python direct to publication. The output usually looks
kind of rough around the edges. Nevertheless, it can be a good starting
point in the data exploration stages. You might also export images and
then touch them up or add information using graphic editing software.
FIGurE 3-11
Graph produced in Python


Search WWH ::

Custom Search