Graphics Programs Reference
In-Depth Information
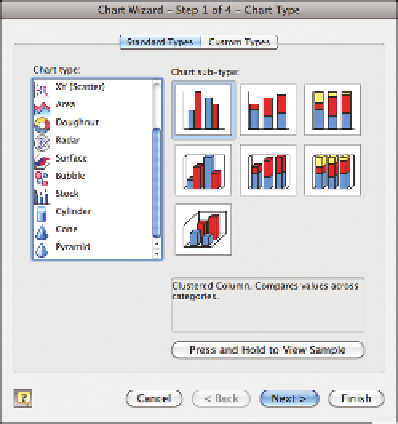
Then you can click the button with the little bar graph on it to make the
chart you want. You get all your standard chart types (Figure 3-2) such as
the bar chart, line, pie, and scatterplot.
Some people scoff at excel, but it's not all that bad for the right tasks. For
example, I don't use excel for any sort of deep analyses or graphics for a
publication, but if I get a small dataset in an excel file, as is often the case,
and I want a quick feel for what is in front of me, then sure, I'll whip up a
graph with a few clicks in everyone's favorite spreadsheet program.
graphs reaLLy
Can
be Fun
The first graph I made on a computer was in Microsoft Excel for my
fifth grade science fair project. My project partner and I tried to find
out which surface snails moved on the fastest. It was ground-breaking
research, I assure you.
Even back then I remember enjoying the graph-making. It took me
forever to learn (the computer was still new to me), but when I finally
did, it was a nice treat. I entered numbers in a spreadsheet and then got
a graph instantly that I could change to any color I wanted—blinding,
bright yellow it is.
FIGurE 3-2
Microsoft excel chart options


Search WWH ::

Custom Search