Graphics Programs Reference
In-Depth Information
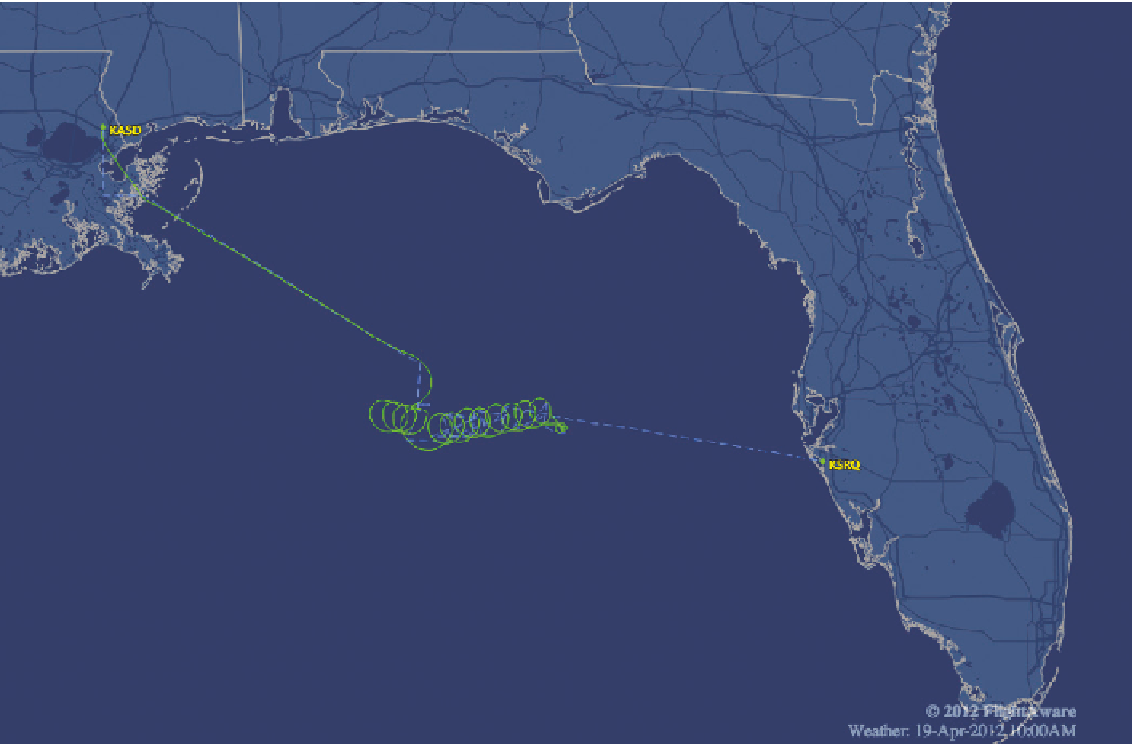
FIGURE 6-17
A flight from Slidell, Louisiana to Sarasota, Florida, according to FlightAware,
http://lightaware.com/live/light/N48DL
Even those who do work with data might not be familiar with a chart type or look
for the same visual features that you might. During my second year of graduate
school, my professor showed us a line chart with an upward trend, and he asked
if there was anything peculiar about it. No one had an answer because all we
saw was a line headed to the upper right. But then he pointed out a small blip
in the line, and that turned out to be the focal point of the chart. By then I had
seen my fair share of charts, so I was surprised that the blip didn't occur to me,
but after the professor pointed it out, the spot on the chart seemed obvious.
So consider what your audience knows and doesn't, and what they need to
know to understand your visualization. Basically, make sure they can decode
the geometry and colors. This is vital because if they can't decipher what a
visualization means, purely from a bits to numbers standpoint, they can't even
get to the part where they relate to the data and form insights (see Figure 6-18).
Search WWH ::

Custom Search