Graphics Programs Reference
In-Depth Information
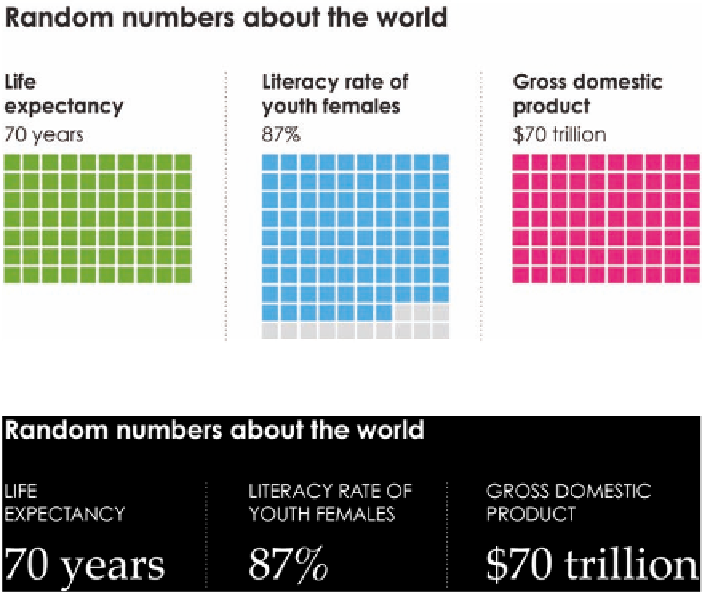
Note:
Some might argue that the figure with
shapes and colors is more “visually compelling,”
but in this case, it's just fluff that fills space.
Actually, you might argue whether three unre-
lated data points require a graphic at all.
Instead, you could do something like Figure 6-7. Simply
display the estimates. The point of visualization is to under-
stand relationships in data and patterns in data, so when you
don't have the data to do that, you don't need to squeeze
out something visual.
FIGURE 6-6
Visualization with-
out comparison
FIGURE 6-7
Just showing the
numbers
MAKING THINGS PRETTY
It's easy to say that a graphic is nice to look at but doesn't provide insight. “It's
just a pretty picture.” The statement often assumes that there's little return
value when you make something beautiful, and that mechanical function is
the only thing that matters when you design data graphics. It assumes that
the only goal of visualizing data is analysis, but as a medium, visualization can
also evoke feelings about a subject and encourage readers to ponder or simply
appreciate the context of the data. Maybe memorability or nostalgia is the goal.
Aesthetics isn't just a shiny veneer that you slap on at the last minute. It rep-
resents the thought you put into a visualization, which is tightly coupled with
clarity and affects interpretation.
Search WWH ::

Custom Search