Graphics Programs Reference
In-Depth Information
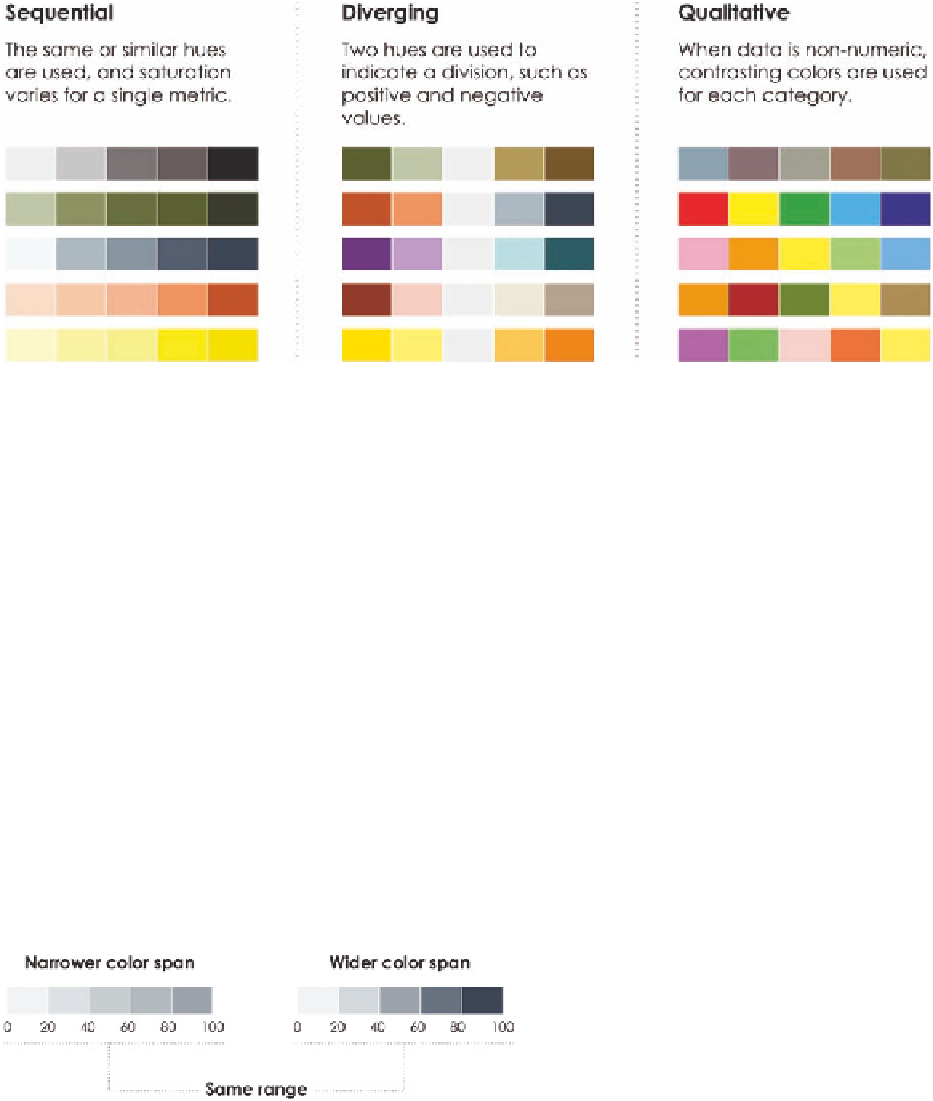
FIGUR E 5-10
Color scale options
A sequential color scale is used to represent a single variable without a sep-
aration requirement (positive versus negative, for example). Darker shades
typically represent higher values and lighter shades represent lower values.
You essentially choose a saturated hue and then decrease the saturation in
increments to create a scale. With the sequential scales in Figure 5-10, the
saturated hues are on the right and saturation is decreased as you shift left.
When you do have a natural or defined split in the data, such as increases and
decreases or political leanings toward two parties, you can use a diverging
color scale. It's like a combination of two (or more) sequential color scales with
a separator in between to indicate a neutral value, such as a change of zero
or a balance of political favor.
Qualitative color scales are useful when your data is categorical or non-nu-
meric. Each color might represent a category, and the varying shades should
provide visual separation.
Regardless of the type of color scale you use, there should be enough variation
between your choice of hues and saturation so that you can see differences.
Choose shades that are too similar and it's a challenge to make comparisons.
A narrow color span restricts the amount
of difference between shades, as shown
on the left of Figure 5-11, whereas a wider
color span on the right makes it easier to
see differences. This works in the oppo-
site direction, too. A color span that's too
wide can exaggerate differences, and if
F I G U R E 5 -11
Color scales that span the same range of values
Search WWH ::

Custom Search