Graphics Programs Reference
In-Depth Information
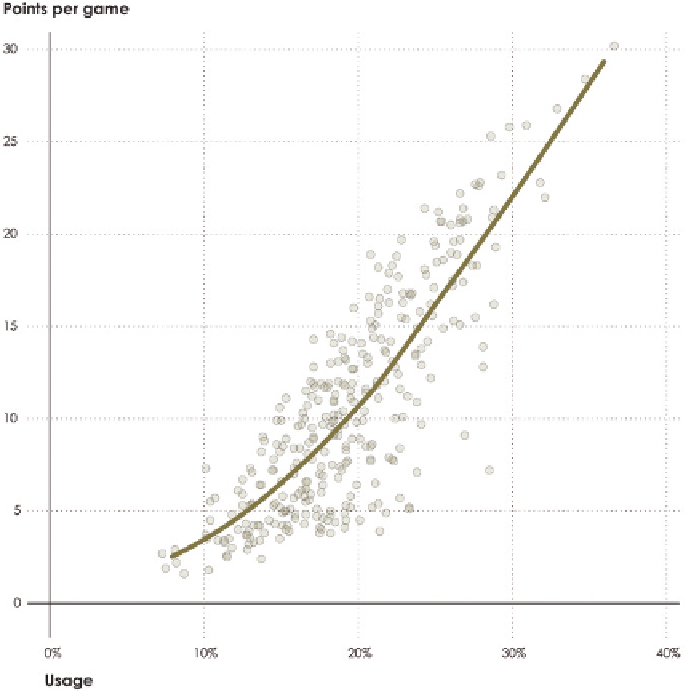
FIGURE 4-38
Fitted LOESS curve
on a scatter plot
As you explore relationships between variables, don't confuse correlation with
causation. Visualization-wise, a correlative and causal relationship between
two variables will look similar, if not the same, but the latter usually requires
rigorous statistical analysis and context from subject experts.
Obviously, some causal relationships are easy to interpret, such as when you
place your hand over an open flame, you burn yourself. That's why you don't walk
around in fire. On the other hand, the price of both milk and fuel has increased
over the years. If you want to decrease the cost at the pump, should you just
decrease the price of milk? Do basketball players score more points because
Search WWH ::

Custom Search