Graphics Programs Reference
In-Depth Information
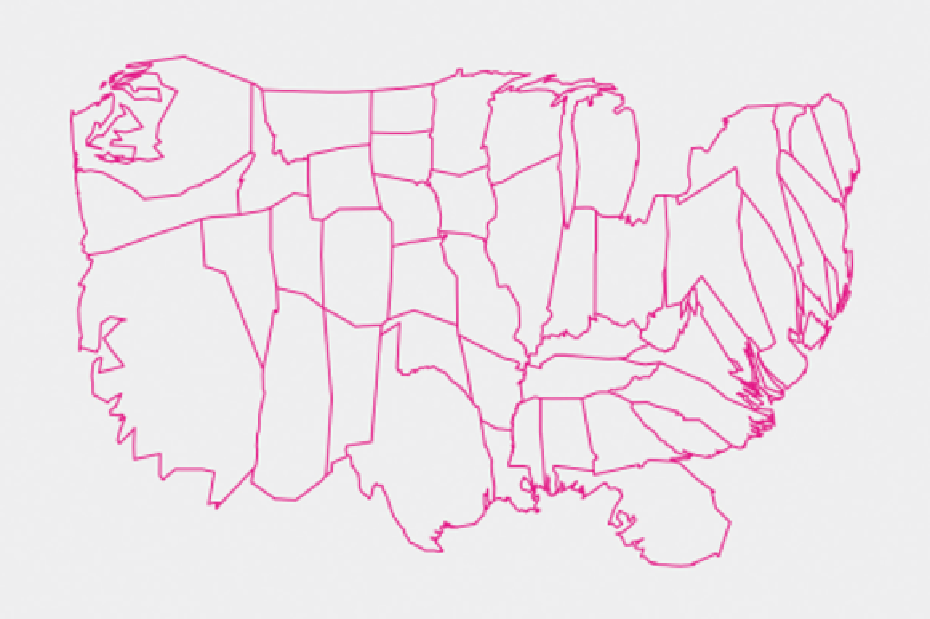
FIGURE 4-35
Diffusion-based cartogram
WHAT TO LOOK FOR
Spatial data is a lot like categorical data, but with a geographic component.
You should know the range of the data to start with, and then look for regional
patterns. Are there higher or lower values clustered in a certain area of a
country or continent? Because a single value only tells you about a small part
about a region filled with people, think about what a pattern implies and look
to other datasets to verify hunches.
MULTIPLE VARIABLES
Data often comes in table form, with multiple columns, and each column
represents a variable. You might have response data from a poll with mul-
tiple questions, results from an experiment that measured multiple aspects
Search WWH ::

Custom Search