Graphics Programs Reference
In-Depth Information
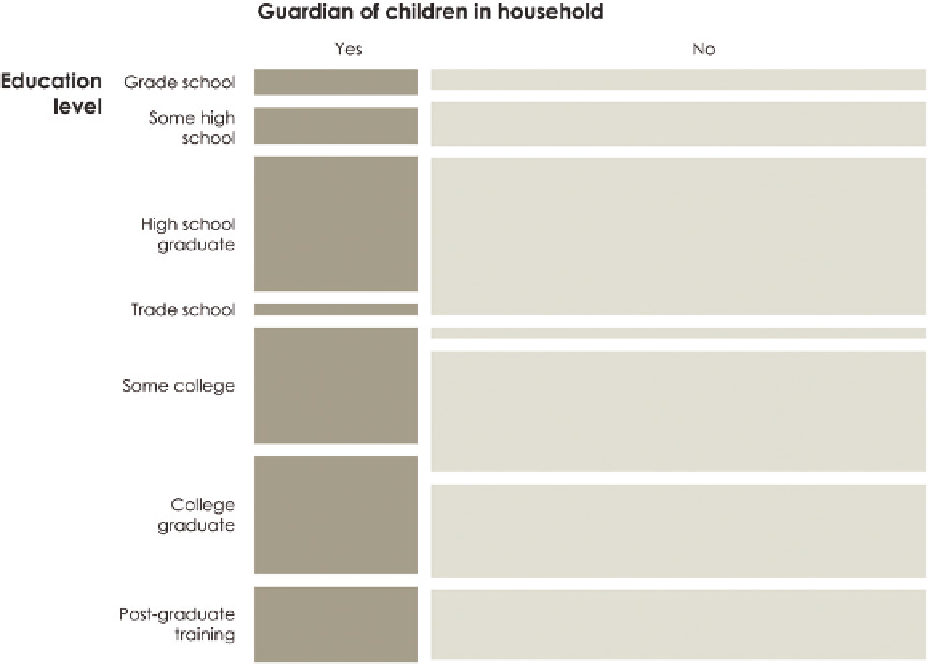
What if you want to know the education level of those who are parents or
guardians versus those who are not? As shown in Figure 4-13, you can introduce
another dimension. It's the same geometry, where more area equals a higher
percentage. But now for example, you can see that of those who are parents,
a slightly lower percentage were college graduates than those who were not.
You can keep going and bring in a third variable. The orientation of education
and parenting are the same, but you can also see e-mail usage. Notice the
vertical split on the subsection in Figure 4-14.
You could keep on adding variables, but as you can see, the plot grows more
challenging to read, so proceed with caution.
WHAT TO LOOK FOR
With categorical data, you often look for the minimum and maximum right away.
This gives you a sense of the range of the dataset, and is easily found with a quick
FIGURE 4-13
Mosaic plot with two variables
Search WWH ::

Custom Search