Graphics Programs Reference
In-Depth Information
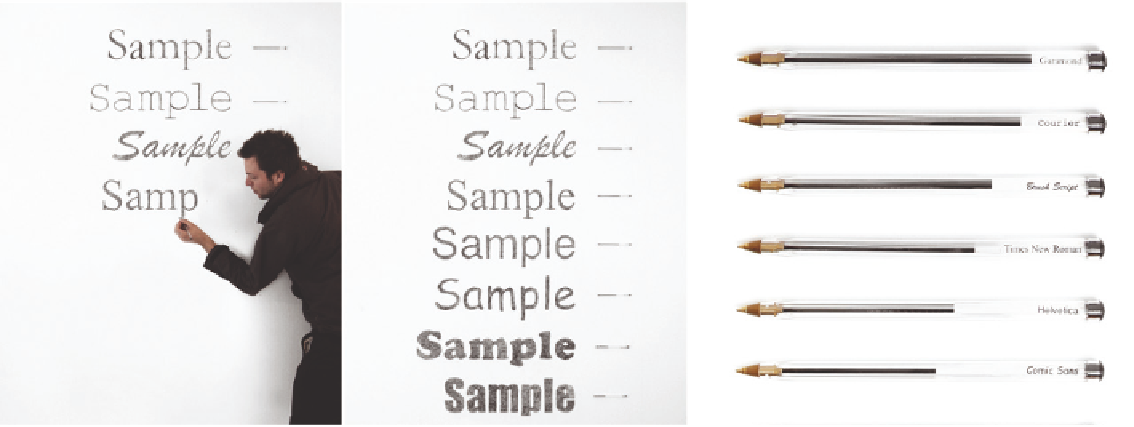
and Tom Wrigglesworth drew “sample” on a wall, with ballpoint pens and
different typefaces. Because ink usage varies by typeface, each pen had a dif-
ferent amount of ink left, which made for an interesting bar graph. There's no
need to label the numeric axis because it's implied by the pens and their ink.
Designer George Kokkinidis approached iPad usage in a similar way; however,
as shown in Figure 3-21, instead of comparing remaining ink, he looked at
fingerprint traces while he used different apps. For example, in Mail, he typed
messages most of the time, so the keyboard pattern is most evident, with
some scrolling on the side. In contrast, most interaction is in the bottom-left
corner for the game Angry Birds.
Of course, you can't always draw on familiar physical objects for context, so
you must provide familiarity and a sense of scale in other ways. The easiest
and most straightforward way is to label your axes and specify units of mea-
sure, or provide a description that tells others what each visual cue represents.
Otherwise, when the data is abstracted, there's no way to decode the shapes,
sizes, and colors, and you might as well show an amorphous blob.
FIGURE 3-20
Measuring Type
(2010) by Matt Robinson and Tom Wrigglesworth,
http://datal.ws/27m
Search WWH ::

Custom Search