Graphics Programs Reference
In-Depth Information
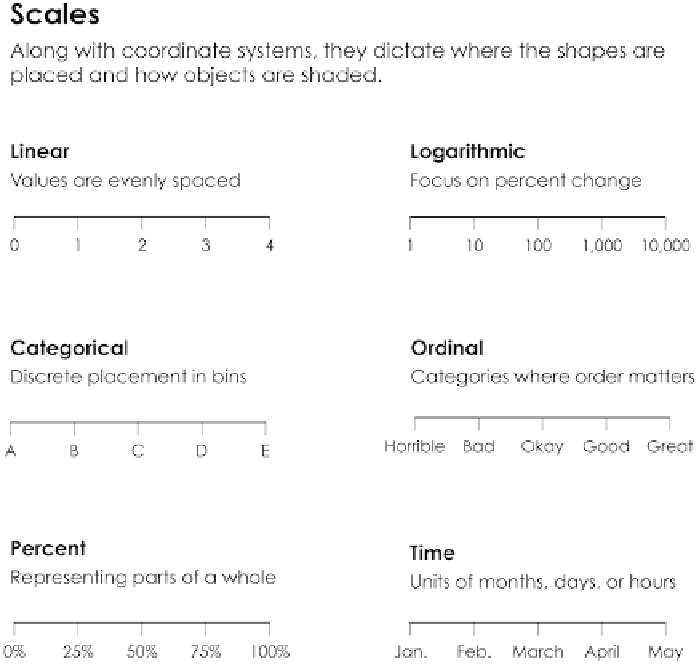
FI G U R E 3-15
Scales
Numeric
The visual spacing on a linear scale is the same regardless of where you are on
the axis. So if you were to measure the distance between two points on the
lower end of the scale, it'd be the same if they were at the high end of the scale.
On the other hand, a logarithmic scale condenses as you increase values.
This scale is used less than the linear scale and is not as well understood or
straightforward for those who don't regularly work with data, but it's useful
if you're interested in percent differences more than you are raw counts or
your data has a wide range.
For example, when you compare state populations in the United States, you
deal with numbers from the hundreds of thousands up to the tens of millions.
As of this writing, California has a population of approximately 38 million peo-
ple, whereas Wyoming has a population of approximately 600,000. As shown
Search WWH ::

Custom Search