Graphics Programs Reference
In-Depth Information
grows more complex. Then substitute the gumballs for people, the jars for
towns, cities, and counties, and the handfuls for randomly distributed surveys,
and a mean with a margin of error carries more weight.
According to Gallup, 48 percent of Americans disapproved of the job Barack
Obama was doing from June 11 through 13 in 2012. However, there was a 3
percent margin of error, which means the difference between more than half
and less than half of the country disapproving. Similarly, during election sea-
son, polls estimate which candidates lead, and if the margin of error is wide,
the results can put more than one person in front, which kind of defeats the
purpose of the poll.
Estimates get tricky when you rank people, places, and things, especially
when you combine measurements (and create statistical models with multiple
variables).
Take education evaluation, for example, which is under constant scrutiny.
Cities, schools, and teachers are often compared against one another, but what
defines a good education or makes an entire city smart? Is it the percentage
of high school students who graduate? The percentage of students who go to
college? Is it the number of universities, libraries, and museums per capita? If
it's all of this, is one count more important than the other, or do you give all of
them equal weight? Answers change depending on who you ask, as do ratings.
Note:
My hometown was ranked the “dumb-
est” city in America by a publication that shall
go unnamed. The rankings were estimates,
which were based on estimates with question-
able uncertainty.
In 2011, the New York City Department of
Education released Teacher Data Reports that
tried to measure teaching quality. The reports
were originally given only to schools and teach-
ers but were later made publicly available in
early 2012. The estimates took several factors
into account, but one of the main ones was the
change in test percentiles from the seventh to
eighth grade.
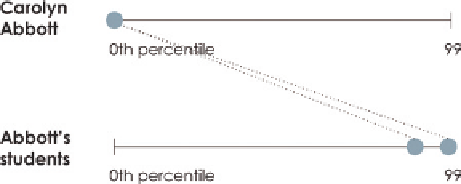
This is how seventh- and eighth-grade math
teacher Carolyn Abbott became known as the
worst math teacher in the city, placed in the
0
th
percentile. However, her seventh-grade stu-
dents scored in the 98
th
percentile. What?
Those students were predicted to score in the
97
th
percentile in the eighth grade, but they
FIGURE 1-24
Carolyn Abbott's rating compared to her students'
Search WWH ::

Custom Search