Graphics Programs Reference
In-Depth Information
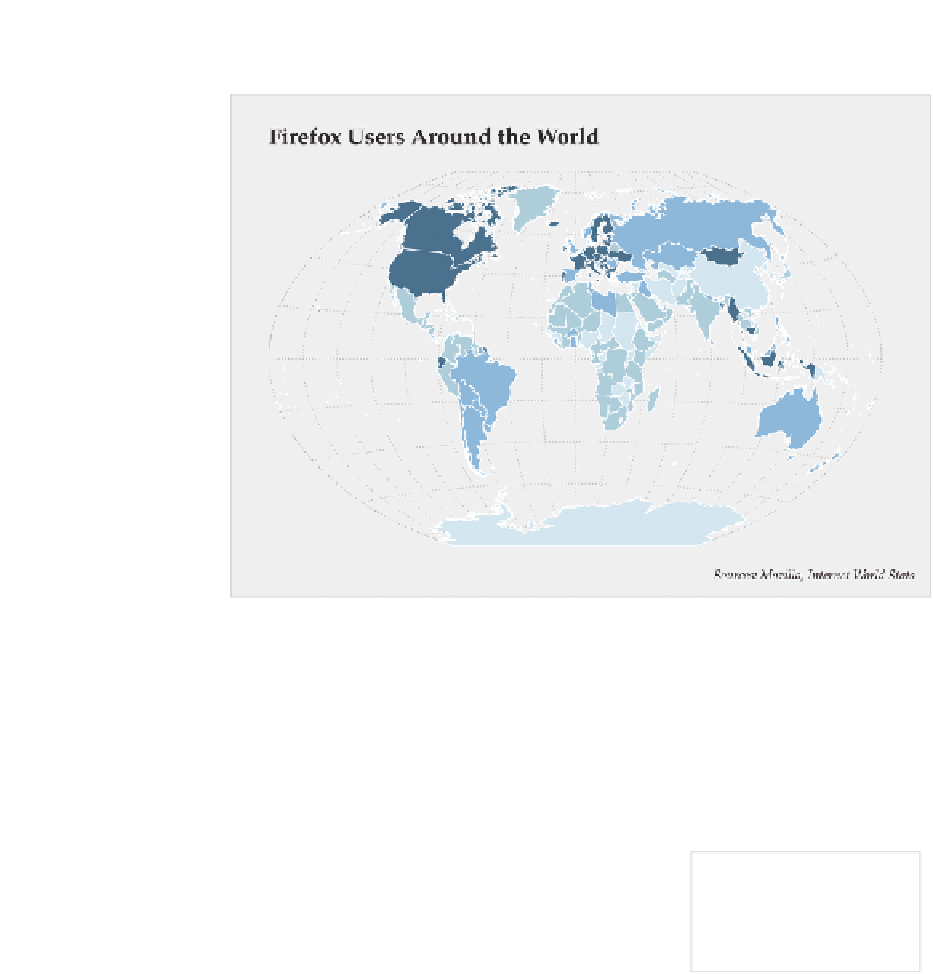
FIGurE 1-9
Firefox usage worldwide by country
You can see different shades of blue for different countries, but what do
they mean? Does dark blue mean more or less usage? If dark blue means
high usage, what qualifies as high usage? As-is, this map is pretty useless
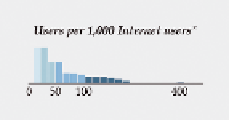
to us. But if you provide the legend in Figure 1-10, it clears things up. The
color legend also serves double time as a histogram showing the distribu-
tion of usage by number of users.
You can also directly label shapes and
objects in your graphic if you have enough
space and not too many categories, as shown
in Figure 1-11. This is a graph that shows the
number of nominations an actor had before
winning an Oscar for best actor.
FIGurE 1-10
Legend for
Firefox usage map

Search WWH ::

Custom Search