Graphics Programs Reference
In-Depth Information
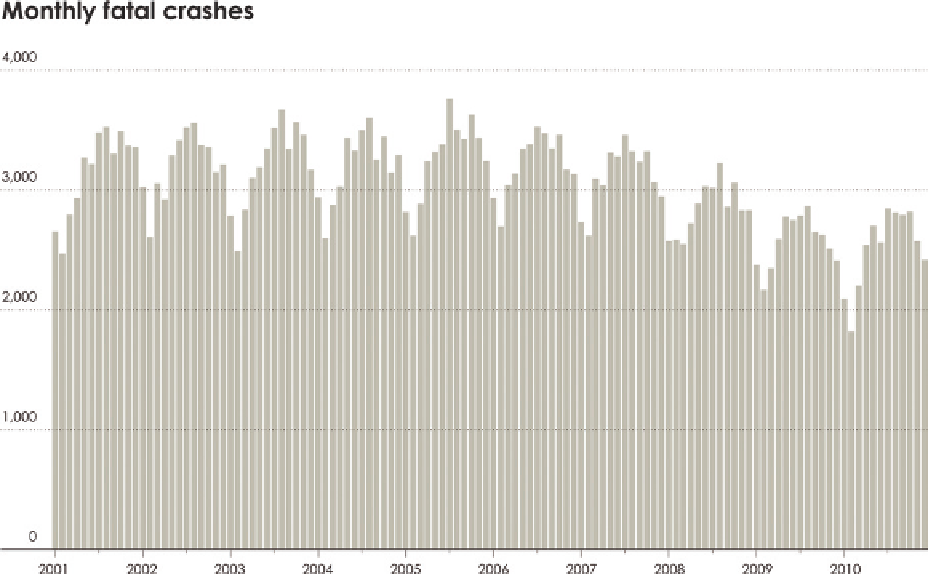
However, there's variability when you compare specific months over the years.
For example, in 2001, the most crashes occurred in August, and there was a small,
relative drop the following month. The same thing happened in 2002 through
2004. However, in 2005 through 2007, July had the most accidents. Then it was
back to August in 2008 through 2010.
On the other hand, February, the month with the fewest days had the least
accidents every year, with the exception of 2008. So there are seasonal varia-
tions and variation within the seasons.
Go down another level to daily crashes, as shown in Figure 1-19, and you see
even higher variability, but it's not all noise. There still appears to be a pattern
of peaks and valleys. Although it's harder to make out the seasonal patterns,
you can see a weekly cycle with more accidents during the weekends than
during the middle of the week. The peak day each week fluctuates between
Friday, Saturday, and Sunday.
FIGUR E 1-18
Monthly fatal accidents
Search WWH ::

Custom Search