Graphics Programs Reference
In-Depth Information
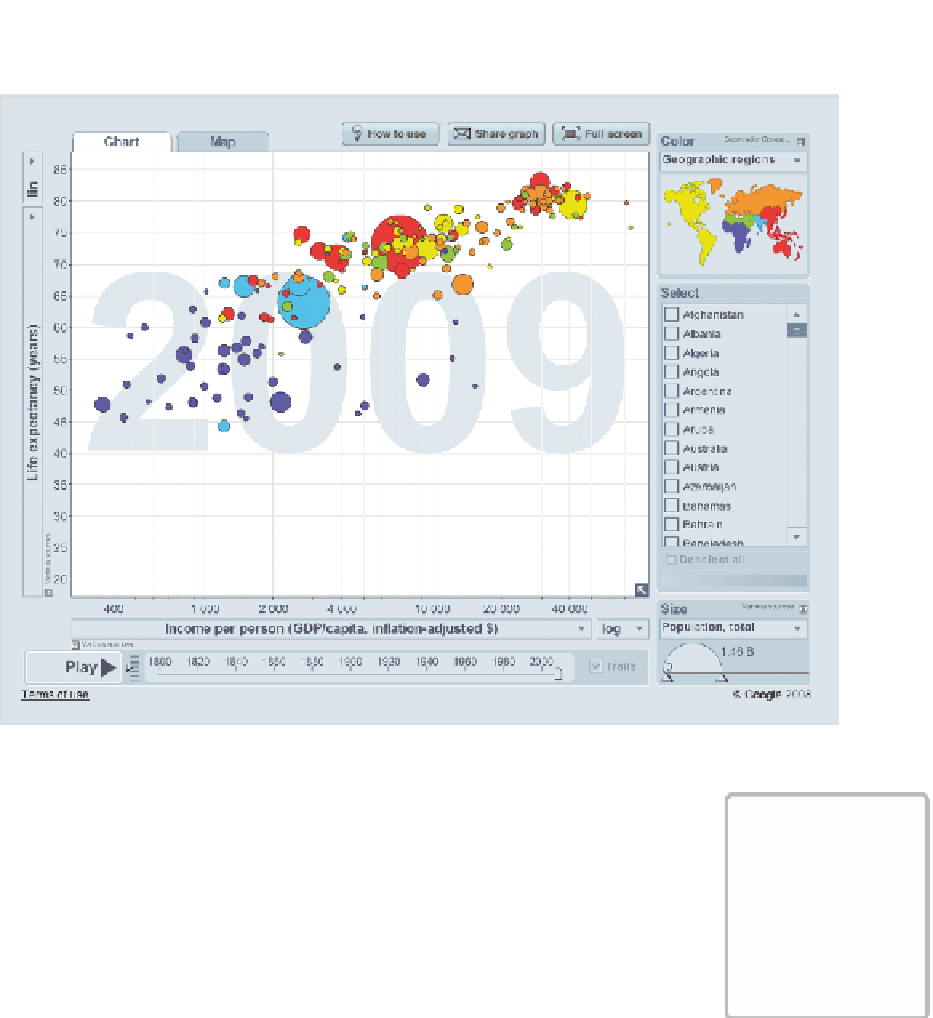
FIGurE 1-4
Trendalyzer by the Gapminder Foundation
I later saw a Gapminder talk on the same topic with the same visualiza-
tions but with a different speaker. It wasn't nearly as exciting. To be hon-
est, it was kind of a snoozer. There wasn't any emotion. I didn't feel any
conviction or excitement about the data. So it's not just about the data that
makes for interesting chatter. It's how you present it and design it that can
help people remember.
Watch Hans
Rosling wow the
audience with
data and an amaz-
ing demonstration
at
http://datafl
.ws/hans
.
When it's all said and done, here's what you need to know. Approach visu-
alization as if you were telling a story. What kind of story are you trying
to tell? Is it a report, or is it a novel? Do you want to convince people that
action is necessary?
Think character development. every data point has a story behind it in the
same way that every character in a topic has a past, present, and future.
There are interactions and relationships between those data points. It's up


Search WWH ::

Custom Search