Graphics Programs Reference
In-Depth Information
Animation
One of the more obvious ways to visualize changes over space and time
is to animate your data. Instead of showing slices in time with individual
maps, you can show the changes as they happen on a single interactive
map. This keeps the intuitiveness of the map, while allowing readers to
explore the data on their own.
A few years ago, I designed a map that shows the growth of Walmart across
the United States, as shown in Figure 8-34. The animation starts with the
fist store that opened in 1962 in Rogers, Arkansas, and then moves through
2010. For each new store that opened up, another dot appears on the map.
The growth is slow at first, and then Walmarts spread across the country
almost like a virus. It keeps growing and growing, with bursts in areas
where the company makes large acquisitions. Before you know it, Walmart
is everywhere.
P
View the Wal-
mart map in its
entirety at
http://
datafl.ws/197
.
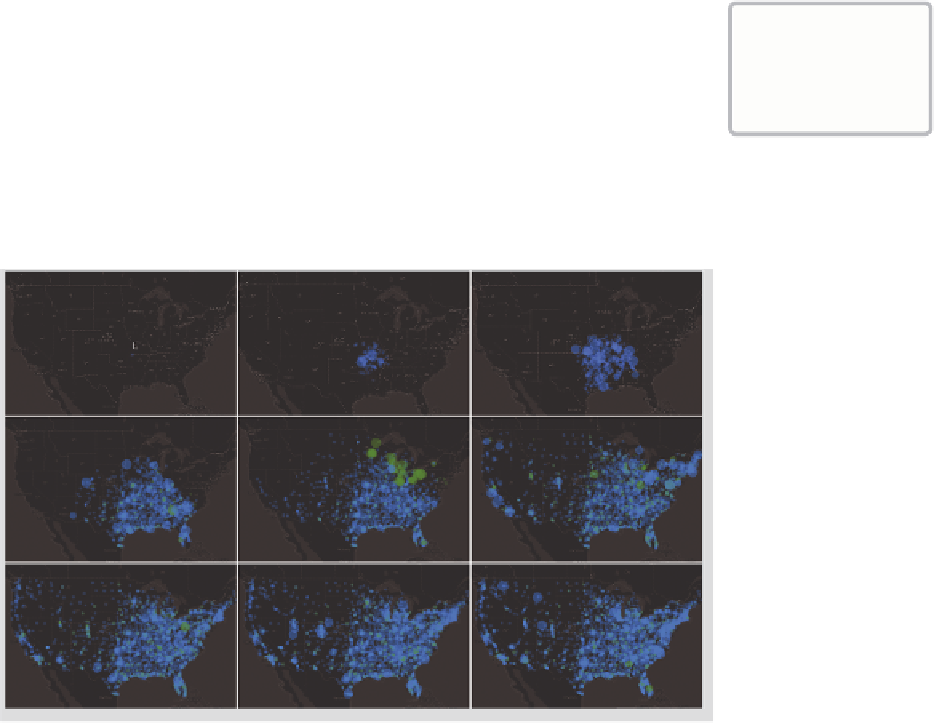
FIGurE 8-34
Animated map showing growth of Walmart stores
At the time, I was just trying to learn Flash and ActionScript, but the map
was shared across the web and has been viewed millions of times. I later
created a similar map showing the growth of Target (Figure 8-35), and it
was equally well spread.


Search WWH ::

Custom Search