Graphics Programs Reference
In-Depth Information
try:
rate = unemployment[p['id']]
except:
continue
if rate > 10:
color_class = 5
elif rate > 8:
color_class = 4
elif rate > 6:
color_class = 3
elif rate > 4:
color_class = 2
elif rate > 2:
color_class = 1
else:
color_class = 0
color = colors[color_class]
p['style'] = path_style + color
P
You can grab
the script in its
entirety here:
http://book
.flowingdata.com/
ch08/regions/
colorize_svg
.py.txt
The last step is to print out the SVG file with
prettify()
. The function con-
verts your soup to a string that your browser can interpret.
print soup.prettify()
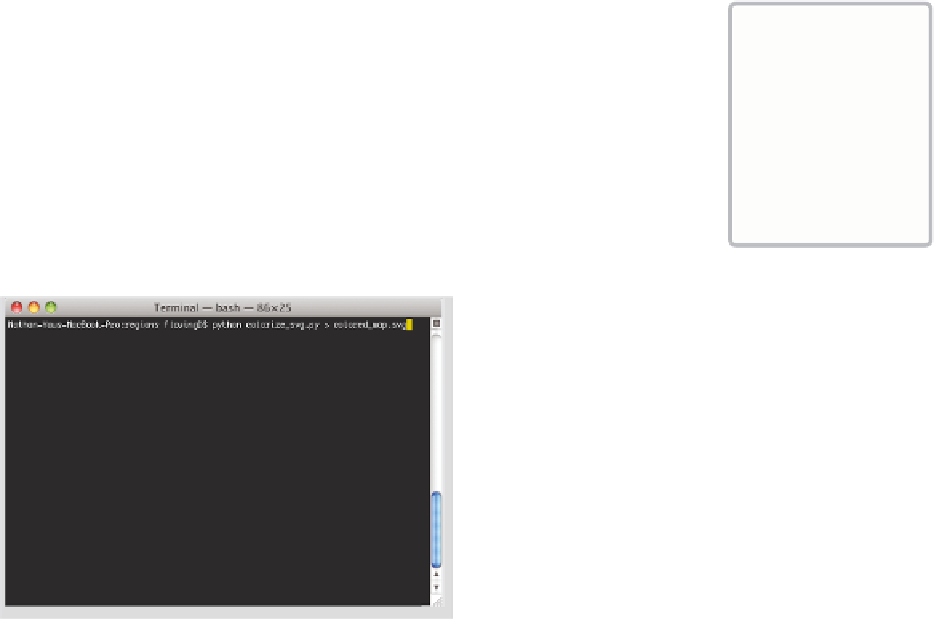
Now all that's left to do is run the Python script and save the output as a
new SVG file named, say,
colored_map.svg
(Figure 8-17).
FIGurE 8-17
Running Python script and saving output as a
new SVG file


Search WWH ::

Custom Search