Graphics Programs Reference
In-Depth Information
To drive the point home, open the map SVG file in a text editor to see what
you're dealing with. It's mostly SVG declarations and boiler plate stuff,
which you don't totally care about right now.
SVG files are
XML files, which
are easy to change
in a text editor.
This also means
that you can parse
the SVG code to
make changes
programmatically.
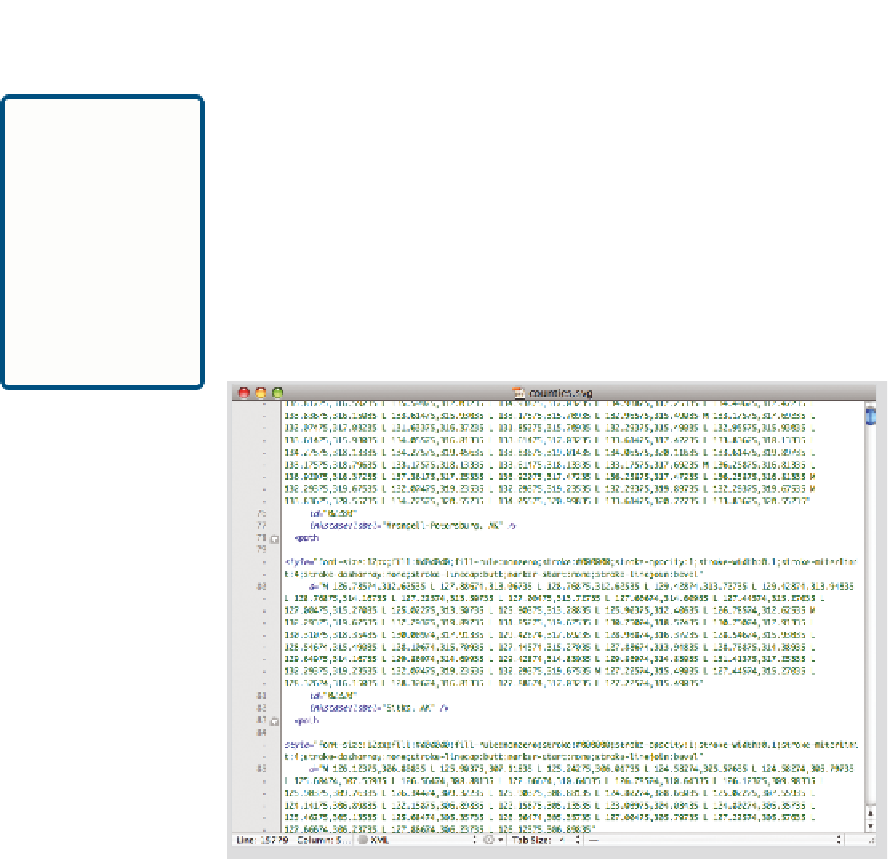
Scroll down some more to start to see some
<path>
tags, as shown in
Figure 8-16. All those numbers in a single tag specify the boundaries of a
county. You're not going to touch those. You're interested in changing the
fill color of each county to match the corresponding unemployment rate.
To do that, you need to edit the
style
in the path.
SVG files are
XML files, which
are easy to change
in a text editor.
This also means
that you can parse
the SVG code to
make changes
programmatically.
FIGurE 8-16
Paths specified in SVG file
Notice how each
<path>
starts with
style
? Those who have written CSS can
immediately recognize this. There is a
fill
attribute followed by a hexa-
decimal color, so if you change that in the SVG file, you change the color
of the output image. You could edit each one manually, but there are more
than 3,000 counties. That would take way too long. Instead, come back to
your old friend Beautiful Soup, the Python package that makes parsing
XML and HTML relatively easy.
Open a blank file in the same directory as your SVG map and unemploy-
ment data. Save it as
colorize_svg.py
. You need to import the CSV data file


Search WWH ::

Custom Search