Graphics Programs Reference
In-Depth Information
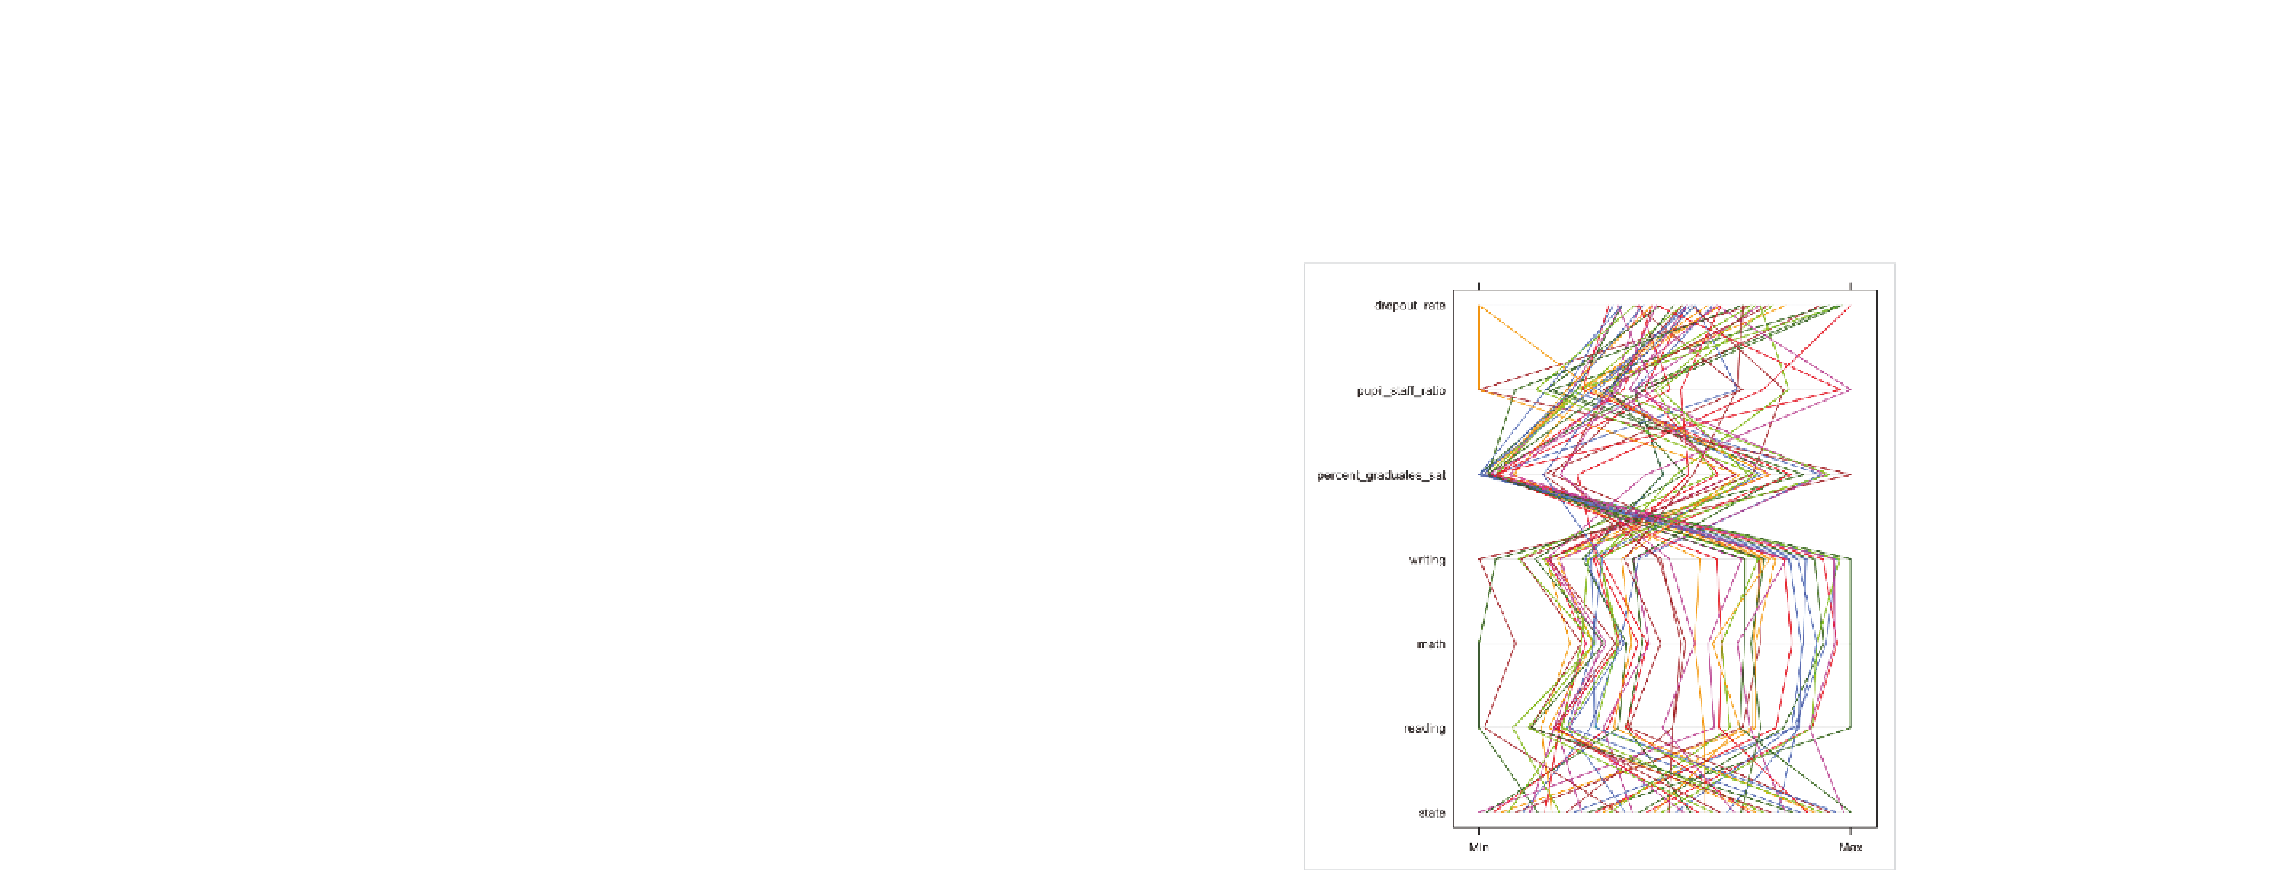
This produces the plot shown in Figure 7-21. Okay, that's quite useless,
actually. There are a bunch of lines all over the place, and the variables go
top to bottom instead of left to right. It looks like rainbow spaghetti at this
point.
FIGurE 7-21
Default parallel coordinates plot with the lattice package
How can you modify this parallel coordinates plot so that you can actually
get some information out of it? For starters, flip it on its side. This is more
of a personal preference than it is a rule, but parallel coordinates left to
right makes more sense, as shown in Figure 7-22.
parallel(education, horizontal.axis=FALSE)
You also don't need to include the
state
column, because for one, it's cat-
egorical, and second, every state has a different name. Now change the

Search WWH ::

Custom Search