Graphics Programs Reference
In-Depth Information
Running in Parallel
Although star charts and Chernoff Faces can make it easier to spot units
that are different from the rest of the pack, it's a challenge to identify
groups or how variables could be related. Parallel coordinates, which
were invented in 1885 by Maurice d'Ocagne, can help with this.
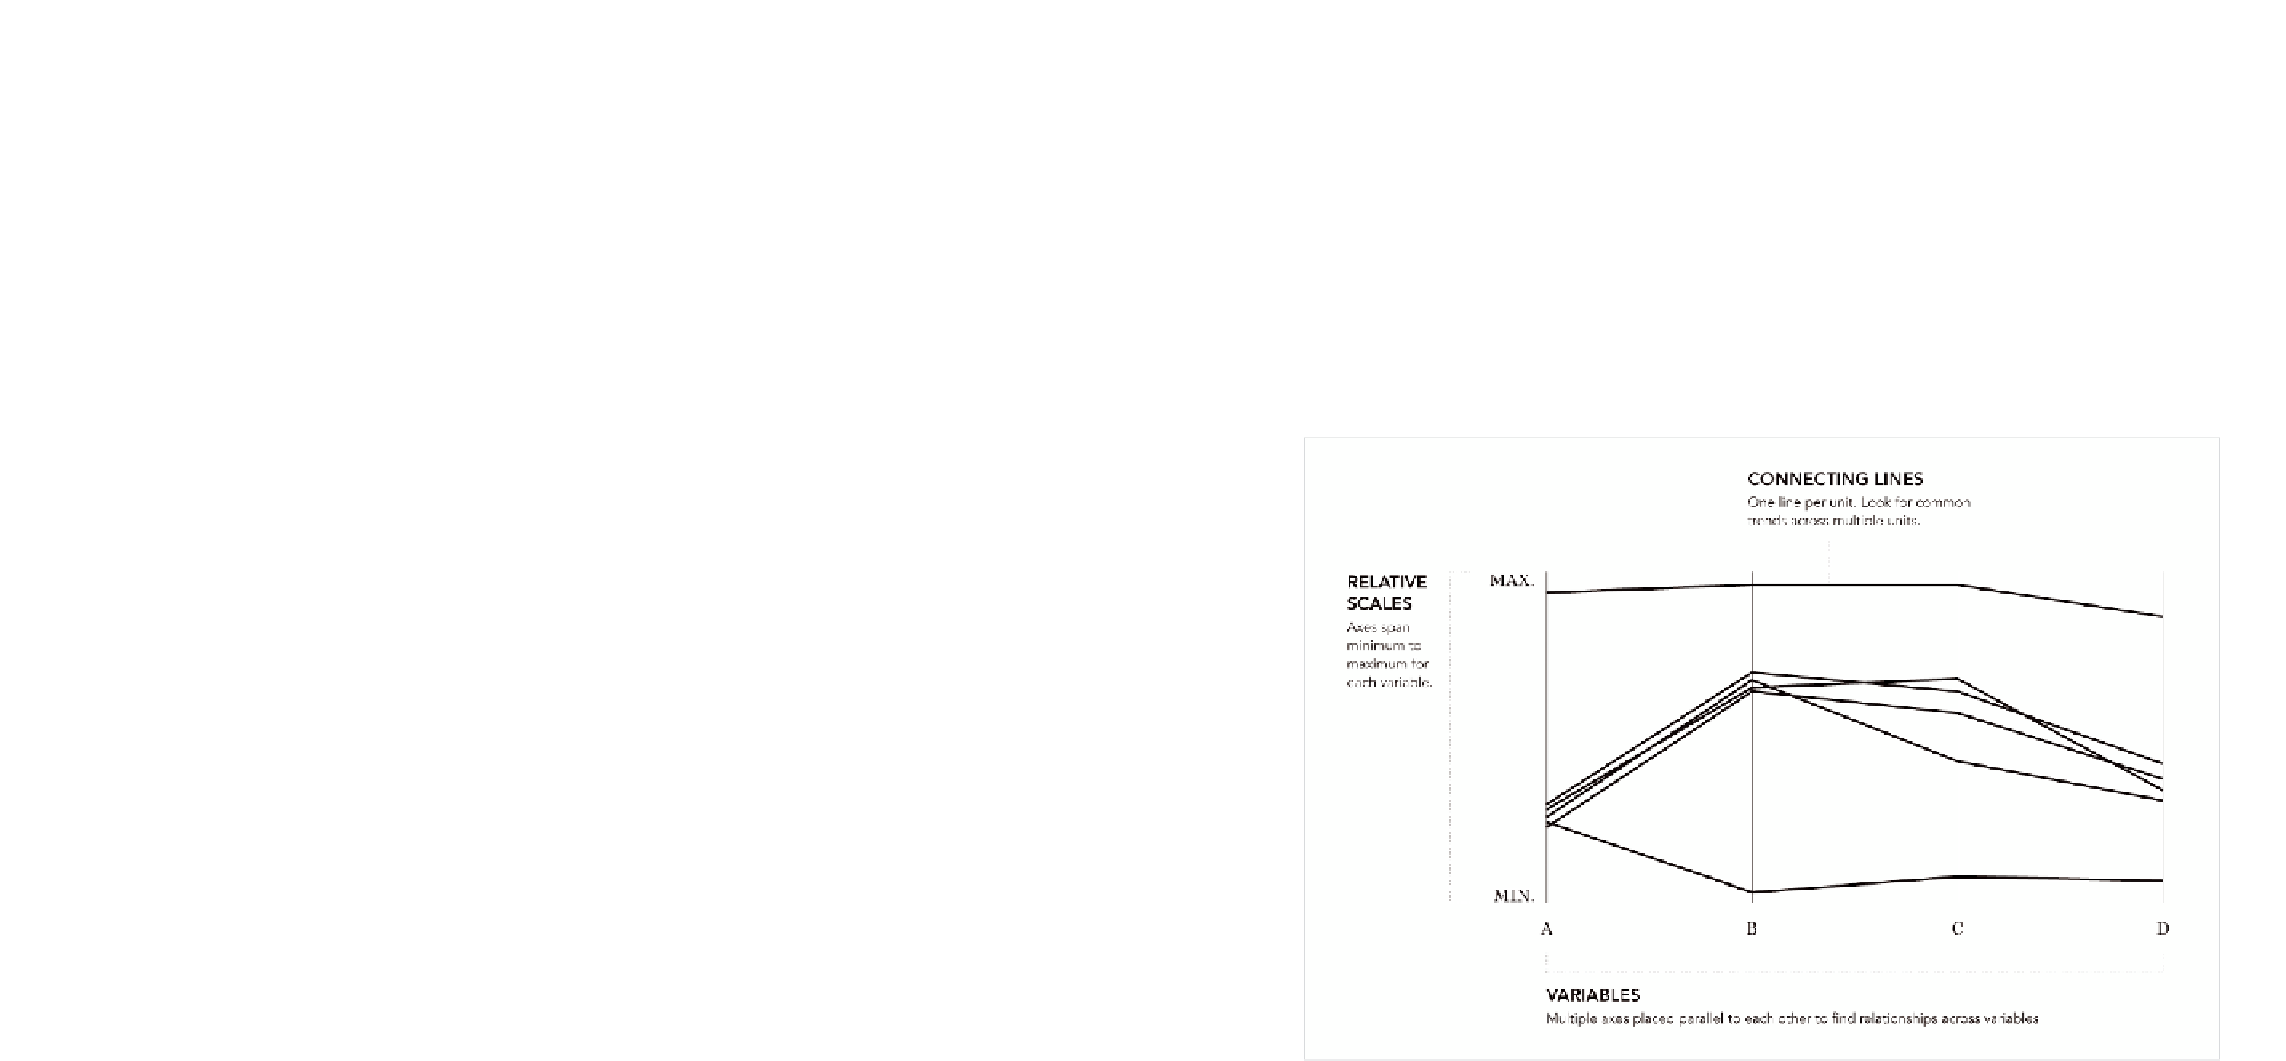
As shown in Figure 7-20, you place multiple axes parallel to each other.
The top of each axis represents a variable's maximum, and the bottom
represents the minimum. For each unit, a line is drawn from left to right,
moving up and down, depending on the unit's values.
FIGurE 7-20
Parallel coordinates framework
For example, imagine you made a plot using the basketball data from ear-
lier in the chapter. For the sake of simplicity, you only plot points, rebound-
ing, and fouls, in that order. Now imagine a player who was a top scorer, a

Search WWH ::

Custom Search