Graphics Programs Reference
In-Depth Information
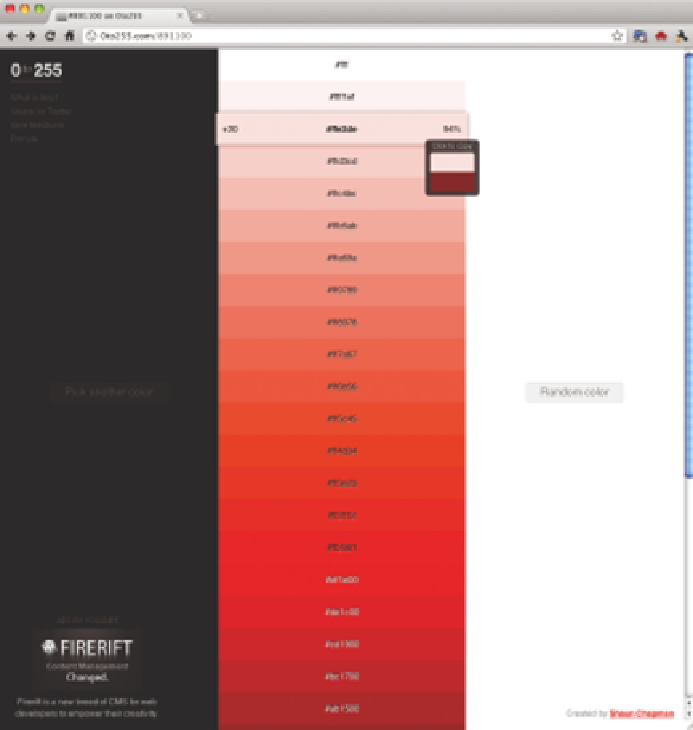
This is great, because you can easily create your own color scale. For
example, you could go to
0to255.com
and pick out the base color and go
from there. Figure 7-5 shows a gradient with a red base. You can pick
a handful of colors, from light to dark, and then easily plug them into
heatmap()
, as shown in Figure 7-6. Instead of using R to create a vector
of colors, you define your own in the
red_colors
variable.
red_colors <- c(“#ffd3cd”, “#ffc4bc”, “#ffb5ab”,
“#ffa69a”, “#ff9789”, “#ff8978”, “#ff7a67”, “#ff6b56”,
“#ff5c45”, “#ff4d34”)
bball_heatmap <- heatmap(bball_matrix, Rowv=NA,
Colv=NA, col = red_colors, scale=”column”, margins=c(5,10))
Choose your
colors wisely
because they also
set the tone for
the context of your
story. For example,
if you deal with a
somber topic, it's
probably better to
stay with more
neutral, muted
tones, whereas
you can use
vibrant colors for a
more uplifting or
casual topic.
FIGurE 7-5
Red gradient from 0to255.com


Search WWH ::

Custom Search